| Red | Green | Blue | |
| z | 17.64 | ||
| znorm | Inf | ||
| sky | -Inf | -Inf | -Inf |
| S/N | 28.7 | 45.5 | 52.9 |
| S/N(c) | 0.0 | 0.0 | 0.0 |
| SN(E/C) |

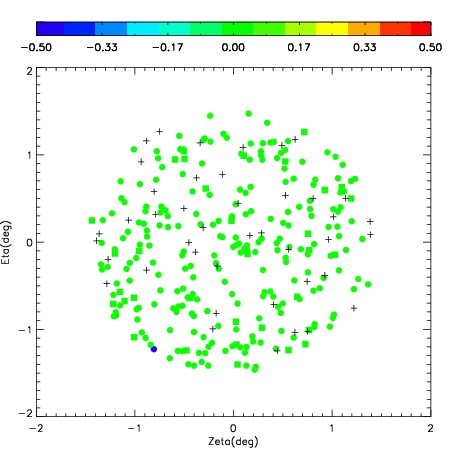
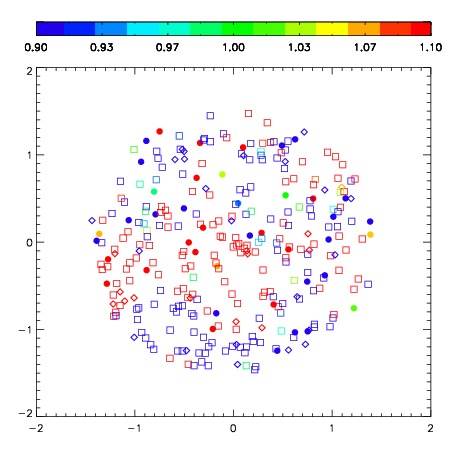

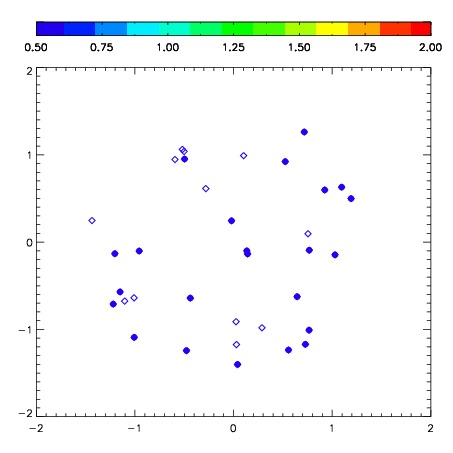
| Frame | Nreads | Zeropoints | Mag plots | Spatial mag deviation | Spatial sky 16325A emission deviations (filled: sky, open: star) | Spatial sky continuum emission | Spatial sky telluric CO2 absorption deviations (filled: H < 10) | |||||||||||||||||||||||
| 0 | 0 |
|
|
|
|
|
|
| IPAIR | NAME | SHIFT | NEWSHIFT | S/N | NAME | SHIFT | NEWSHIFT | S/N |
| 0 | 03420090 | 0.362361 | 0.00000 | 290.192 | 03420092 | -0.0264344 | 0.388795 | 293.678 |
| 1 | 03420086 | 0.354412 | 0.00794902 | 289.385 | 03420091 | -0.0264348 | 0.388796 | 293.062 |
| 2 | 03420085 | 0.352966 | 0.00939500 | 288.688 | 03420087 | -0.0257938 | 0.388155 | 289.163 |
| 3 | 03420089 | 0.359146 | 0.00321501 | 280.899 | 03420084 | 0.00000 | 0.362361 | 285.949 |