| Red | Green | Blue | |
| z | 17.64 | ||
| znorm | Inf | ||
| sky | -Inf | -Inf | -Inf |
| S/N | 29.9 | 49.6 | 57.2 |
| S/N(c) | 0.0 | 0.0 | 0.0 |
| SN(E/C) |

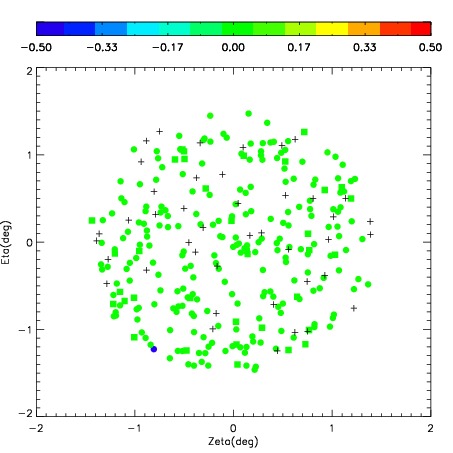
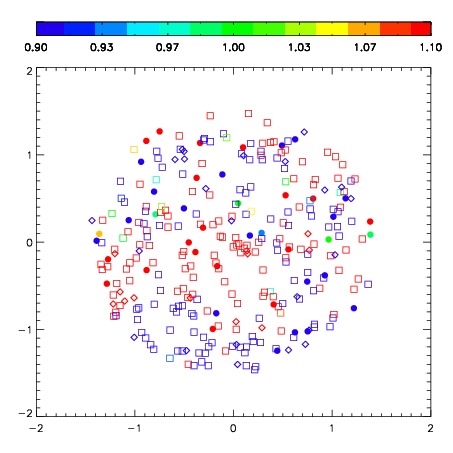
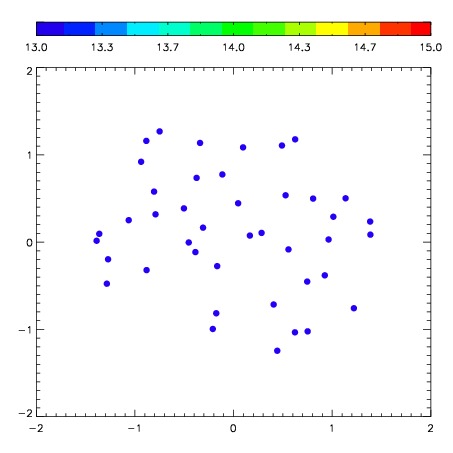

| Frame | Nreads | Zeropoints | Mag plots | Spatial mag deviation | Spatial sky 16325A emission deviations (filled: sky, open: star) | Spatial sky continuum emission | Spatial sky telluric CO2 absorption deviations (filled: H < 10) | |||||||||||||||||||||||
| 0 | 0 |
|
|
|
|
|
|
| IPAIR | NAME | SHIFT | NEWSHIFT | S/N | NAME | SHIFT | NEWSHIFT | S/N |
| 0 | 03430099 | 0.361797 | 0.00000 | 273.159 | 03430100 | -0.0295319 | 0.391329 | 277.089 |
| 1 | 03430098 | 0.356511 | 0.00528601 | 266.986 | 03430105 | -0.0326811 | 0.394478 | 273.346 |
| 2 | 03430102 | 0.359006 | 0.00279102 | 263.868 | 03430101 | -0.0308223 | 0.392619 | 269.565 |
| 3 | 03430103 | 0.360083 | 0.00171399 | 260.145 | 03430104 | -0.0313503 | 0.393147 | 265.946 |
| 4 | 03430106 | 0.361756 | 4.10080e-05 | 257.441 | 03430097 | 0.00000 | 0.361797 | 262.668 |