| Red | Green | Blue | |
| z | 17.64 | ||
| znorm | Inf | ||
| sky | -NaN | -Inf | -Inf |
| S/N | 17.3 | 32.6 | 38.1 |
| S/N(c) | 0.0 | 0.0 | 0.0 |
| SN(E/C) |


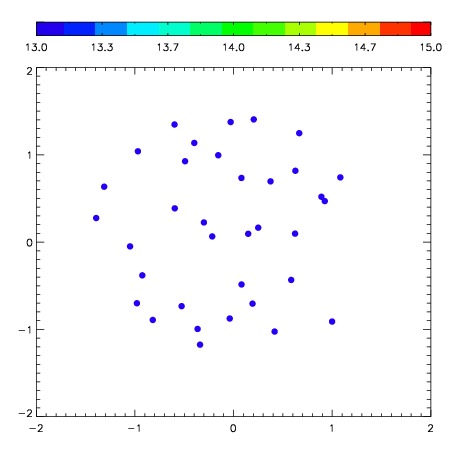
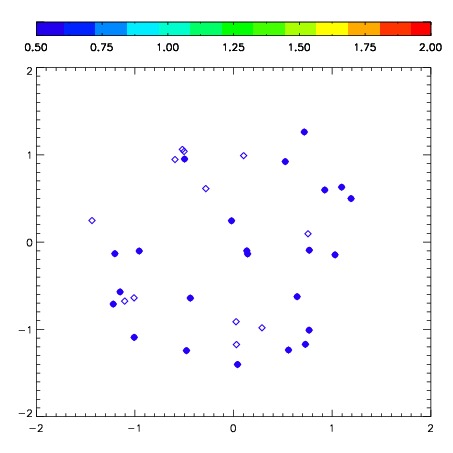
| Frame | Nreads | Zeropoints | Mag plots | Spatial mag deviation | Spatial sky 16325A emission deviations (filled: sky, open: star) | Spatial sky continuum emission | Spatial sky telluric CO2 absorption deviations (filled: H < 10) | |||||||||||||||||||||||
| 0 | 0 |
|
|
|
|
|
|
| IPAIR | NAME | SHIFT | NEWSHIFT | S/N | NAME | SHIFT | NEWSHIFT | S/N |
| 0 | 03760083 | 0.438575 | 0.00000 | 145.122 | 03760080 | 0.00866184 | 0.429913 | 135.145 |
| 1 | 03760082 | 0.428392 | 0.0101830 | 147.801 | 03760084 | 0.00714409 | 0.431431 | 149.288 |
| 2 | 03760079 | 0.426598 | 0.0119770 | 147.252 | 03760081 | 0.00746326 | 0.431112 | 145.102 |
| 3 | 03760078 | 0.424962 | 0.0136130 | 147.137 | 03760077 | 0.00000 | 0.438575 | 138.675 |