| Red | Green | Blue | |
| z | 17.64 | ||
| znorm | Inf | ||
| sky | -NaN | -NaN | -Inf |
| S/N | 24.6 | 43.7 | 46.8 |
| S/N(c) | 0.0 | 0.0 | 0.0 |
| SN(E/C) |

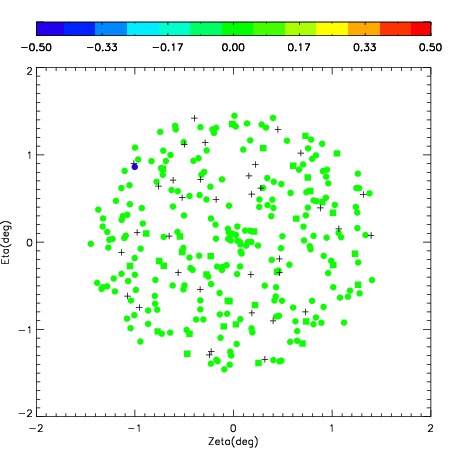
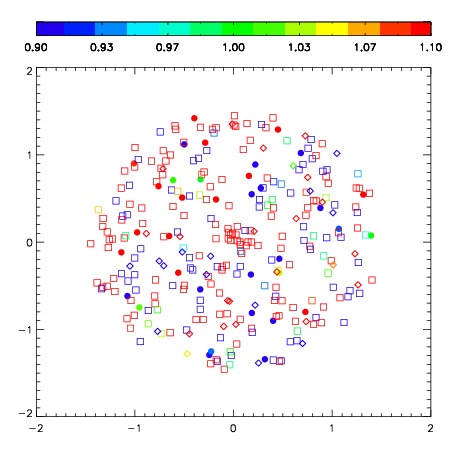
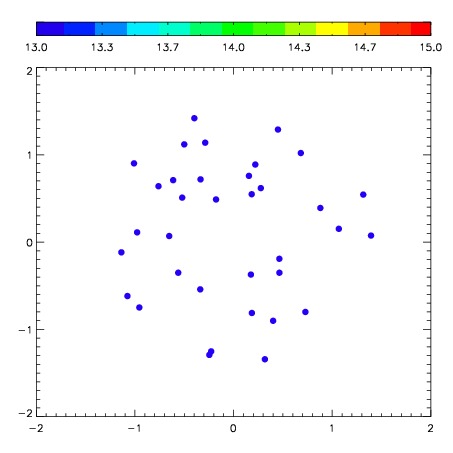

| Frame | Nreads | Zeropoints | Mag plots | Spatial mag deviation | Spatial sky 16325A emission deviations (filled: sky, open: star) | Spatial sky continuum emission | Spatial sky telluric CO2 absorption deviations (filled: H < 10) | |||||||||||||||||||||||
| 0 | 0 |
|
|
|
|
|
|
| IPAIR | NAME | SHIFT | NEWSHIFT | S/N | NAME | SHIFT | NEWSHIFT | S/N |
| 0 | 03100103 | 0.410989 | 0.00000 | 270.525 | 03100098 | 0.00000 | 0.410989 | 269.237 |
| 1 | 03100100 | 0.408566 | 0.00242299 | 273.639 | 03100102 | -0.0375935 | 0.448582 | 279.681 |
| 2 | 03100099 | 0.404976 | 0.00601298 | 272.419 | 03100101 | -0.0359360 | 0.446925 | 277.526 |