| Red | Green | Blue | |
| z | 17.64 | ||
| znorm | Inf | ||
| sky | -NaN | -NaN | -Inf |
| S/N | 36.4 | 65.4 | 70.3 |
| S/N(c) | 0.0 | 0.0 | 0.0 |
| SN(E/C) |

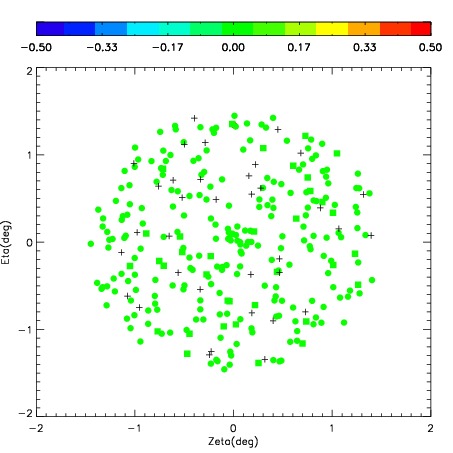
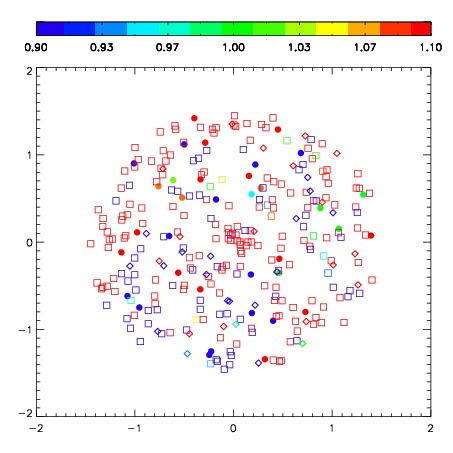

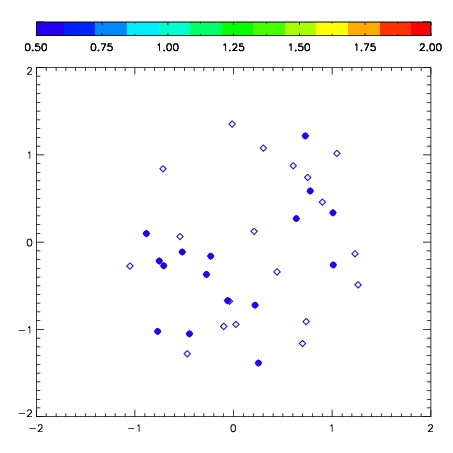
| Frame | Nreads | Zeropoints | Mag plots | Spatial mag deviation | Spatial sky 16325A emission deviations (filled: sky, open: star) | Spatial sky continuum emission | Spatial sky telluric CO2 absorption deviations (filled: H < 10) | |||||||||||||||||||||||
| 0 | 0 |
|
|
|
|
|
|
| IPAIR | NAME | SHIFT | NEWSHIFT | S/N | NAME | SHIFT | NEWSHIFT | S/N |
| 0 | 03430088 | 0.381613 | 0.00000 | 248.643 | 03430082 | -0.0439365 | 0.425549 | 250.589 |
| 1 | 03430092 | 0.373418 | 0.00819498 | 284.763 | 03430093 | -0.0483601 | 0.429973 | 282.120 |
| 2 | 03430091 | 0.372050 | 0.00956300 | 284.256 | 03430085 | -0.0442286 | 0.425842 | 271.914 |
| 3 | 03430084 | 0.375398 | 0.00621498 | 267.489 | 03430090 | -0.0490345 | 0.430647 | 268.609 |
| 4 | 03430087 | 0.376157 | 0.00545600 | 257.849 | 03430086 | -0.0510077 | 0.432621 | 266.884 |
| 5 | 03430083 | 0.372915 | 0.00869799 | 257.653 | 03430089 | -0.0411641 | 0.422777 | 255.682 |
| 6 | 03430080 | 0.376456 | 0.00515699 | 228.980 | 03430081 | -0.0450947 | 0.426708 | 231.555 |
| 7 | 03430079 | 0.367691 | 0.0139220 | 224.159 | 03430078 | 0.00000 | 0.381613 | 205.982 |