| Red | Green | Blue | |
| z | 17.64 | ||
| znorm | Inf | ||
| sky | -Inf | -Inf | -Inf |
| S/N | 28.3 | 45.3 | 47.7 |
| S/N(c) | 0.0 | 0.0 | 0.0 |
| SN(E/C) |
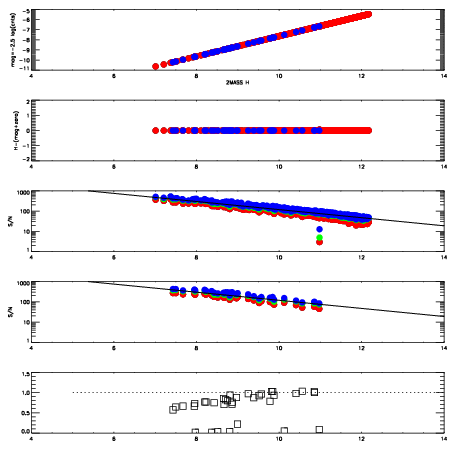


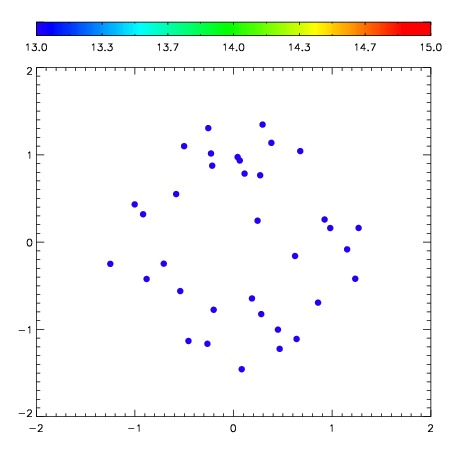
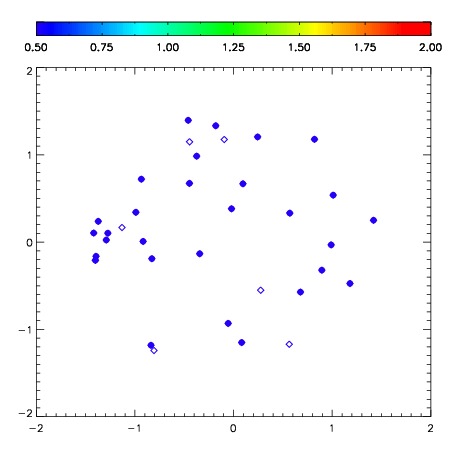
| Frame | Nreads | Zeropoints | Mag plots | Spatial mag deviation | Spatial sky 16325A emission deviations (filled: sky, open: star) | Spatial sky continuum emission | Spatial sky telluric CO2 absorption deviations (filled: H < 10) | |||||||||||||||||||||||
| 0 | 0 |
|
|
|
|
|
|
| IPAIR | NAME | SHIFT | NEWSHIFT | S/N | NAME | SHIFT | NEWSHIFT | S/N |
| 0 | 10240027 | 0.420929 | 0.00000 | 252.865 | 10240029 | 0.0414298 | 0.379499 | 257.839 |
| 1 | 10240032 | 0.409536 | 0.0113930 | 259.977 | 10240033 | 0.0368602 | 0.384069 | 259.974 |
| 2 | 10240028 | 0.419610 | 0.00131902 | 255.246 | 10240030 | 0.0403640 | 0.380565 | 259.740 |
| 3 | 10240031 | 0.412602 | 0.00832701 | 254.247 | 10240026 | 0.00000 | 0.420929 | 259.665 |