| Red | Green | Blue | |
| z | 17.64 | ||
| znorm | Inf | ||
| sky | -NaN | -NaN | -Inf |
| S/N | 25.7 | 43.1 | 45.1 |
| S/N(c) | 0.0 | 0.0 | 0.0 |
| SN(E/C) |


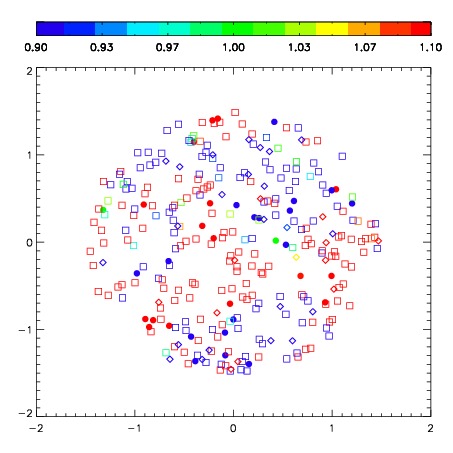


| Frame | Nreads | Zeropoints | Mag plots | Spatial mag deviation | Spatial sky 16325A emission deviations (filled: sky, open: star) | Spatial sky continuum emission | Spatial sky telluric CO2 absorption deviations (filled: H < 10) | |||||||||||||||||||||||
| 0 | 0 |
|
|
|
|
|
|
| IPAIR | NAME | SHIFT | NEWSHIFT | S/N | NAME | SHIFT | NEWSHIFT | S/N |
| 0 | 03430014 | 0.444761 | 0.00000 | 323.889 | 03430012 | 0.00421807 | 0.440543 | 321.805 |
| 1 | 03430010 | 0.438917 | 0.00584400 | 333.869 | 03430011 | 0.00280435 | 0.441957 | 330.403 |
| 2 | 03430009 | 0.439617 | 0.00514400 | 328.203 | 03430015 | 0.00500207 | 0.439759 | 325.545 |
| 3 | 03430013 | 0.437599 | 0.00716200 | 318.095 | 03430008 | 0.00000 | 0.444761 | 317.819 |