| Red | Green | Blue | |
| z | 17.64 | ||
| znorm | Inf | ||
| sky | -Inf | -Inf | -Inf |
| S/N | 19.8 | 34.9 | 36.0 |
| S/N(c) | 0.0 | 0.0 | 0.0 |
| SN(E/C) |

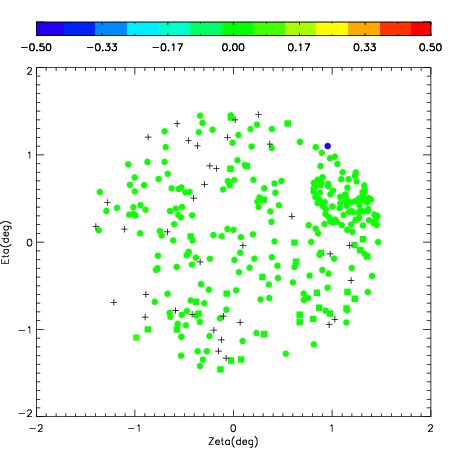
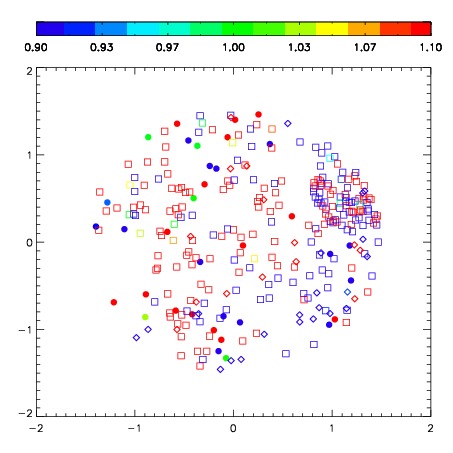


| Frame | Nreads | Zeropoints | Mag plots | Spatial mag deviation | Spatial sky 16325A emission deviations (filled: sky, open: star) | Spatial sky continuum emission | Spatial sky telluric CO2 absorption deviations (filled: H < 10) | |||||||||||||||||||||||
| 0 | 0 |
|
|
|
|
|
|
| IPAIR | NAME | SHIFT | NEWSHIFT | S/N | NAME | SHIFT | NEWSHIFT | S/N |
| 0 | 07220012 | 0.494245 | 0.00000 | 214.782 | 07220015 | 0.0322812 | 0.461964 | 233.463 |
| 1 | 07220016 | 0.481755 | 0.0124900 | 229.986 | 07220011 | 0.00000 | 0.494245 | 256.508 |
| 2 | 07220017 | 0.486223 | 0.00802198 | 224.291 | 07220018 | 0.0354695 | 0.458775 | 238.881 |
| 3 | 07220013 | 0.490082 | 0.00416300 | 211.633 | 07220014 | 0.0350215 | 0.459224 | 212.906 |