| Red | Green | Blue | |
| z | 17.64 | ||
| znorm | Inf | ||
| sky | -NaN | -NaN | -Inf |
| S/N | 24.4 | 44.3 | 47.8 |
| S/N(c) | 0.0 | 0.0 | 0.0 |
| SN(E/C) |

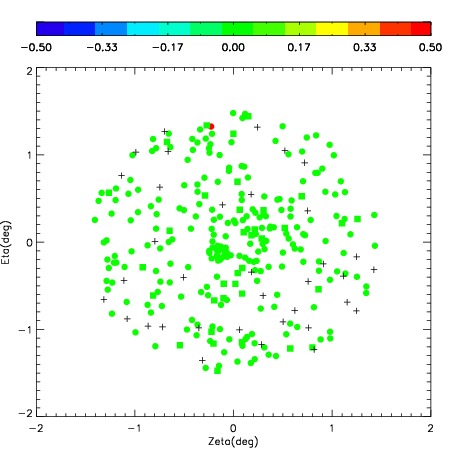
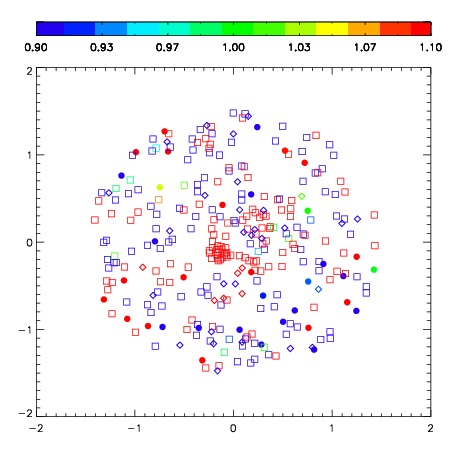


| Frame | Nreads | Zeropoints | Mag plots | Spatial mag deviation | Spatial sky 16325A emission deviations (filled: sky, open: star) | Spatial sky continuum emission | Spatial sky telluric CO2 absorption deviations (filled: H < 10) | |||||||||||||||||||||||
| 0 | 0 |
|
|
|
|
|
|
| IPAIR | NAME | SHIFT | NEWSHIFT | S/N | NAME | SHIFT | NEWSHIFT | S/N |
| 0 | 03410053 | 0.382080 | 0.00000 | 263.998 | 03410051 | 0.00554785 | 0.376532 | 290.837 |
| 1 | 03410054 | 0.368159 | 0.0139210 | 293.117 | 03410055 | -0.000353739 | 0.382434 | 303.369 |
| 2 | 03410050 | 0.373438 | 0.00864199 | 284.843 | 03410052 | 0.00539532 | 0.376685 | 298.119 |
| 3 | 03410049 | 0.373880 | 0.00819999 | 280.375 | 03410048 | 0.00000 | 0.382080 | 294.008 |