| Red | Green | Blue | |
| z | 17.64 | ||
| znorm | Inf | ||
| sky | -Inf | -Inf | -Inf |
| S/N | 22.7 | 37.9 | 41.4 |
| S/N(c) | 0.0 | 0.0 | 0.0 |
| SN(E/C) |

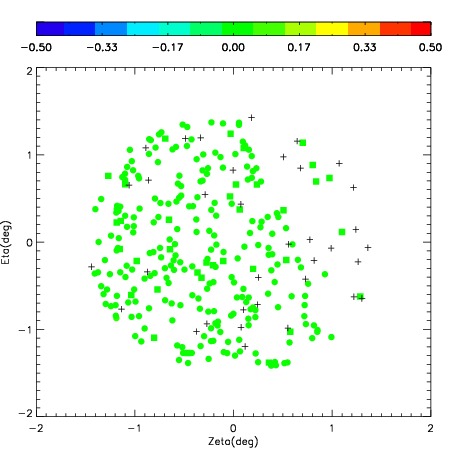
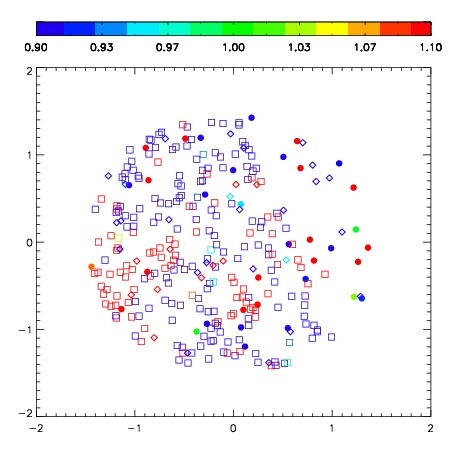
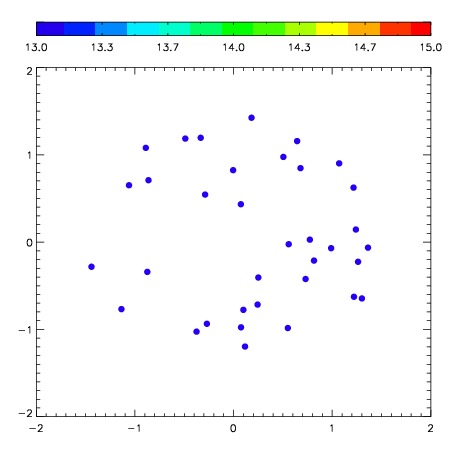

| Frame | Nreads | Zeropoints | Mag plots | Spatial mag deviation | Spatial sky 16325A emission deviations (filled: sky, open: star) | Spatial sky continuum emission | Spatial sky telluric CO2 absorption deviations (filled: H < 10) | |||||||||||||||||||||||
| 0 | 0 |
|
|
|
|
|
|
| IPAIR | NAME | SHIFT | NEWSHIFT | S/N | NAME | SHIFT | NEWSHIFT | S/N |
| 0 | 03180042 | 0.306598 | 0.00000 | 286.814 | 03180036 | 0.00000 | 0.306598 | 284.413 |
| 1 | 03180038 | 0.293112 | 0.0134860 | 293.591 | 03180040 | -0.00727035 | 0.313868 | 286.717 |
| 2 | 03180037 | 0.286702 | 0.0198960 | 289.416 | 03180039 | -0.00795354 | 0.314552 | 284.516 |
| 3 | 03180041 | 0.304125 | 0.00247300 | 280.076 | 03180043 | -0.00986725 | 0.316465 | 277.354 |