| Red | Green | Blue | |
| z | 17.64 | ||
| znorm | Inf | ||
| sky | -Inf | -Inf | -Inf |
| S/N | 17.0 | 30.0 | 32.8 |
| S/N(c) | 0.0 | 0.0 | 0.0 |
| SN(E/C) |


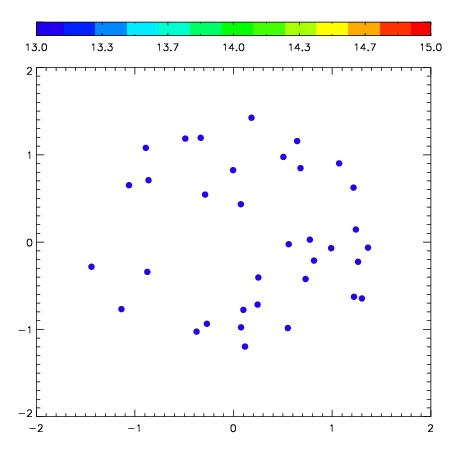
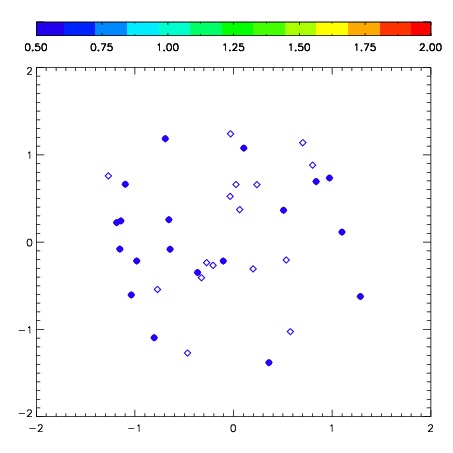
| Frame | Nreads | Zeropoints | Mag plots | Spatial mag deviation | Spatial sky 16325A emission deviations (filled: sky, open: star) | Spatial sky continuum emission | Spatial sky telluric CO2 absorption deviations (filled: H < 10) | |||||||||||||||||||||||
| 0 | 0 |
|
|
|
|
|
|
| IPAIR | NAME | SHIFT | NEWSHIFT | S/N | NAME | SHIFT | NEWSHIFT | S/N |
| 0 | 03770030 | 0.392615 | 0.00000 | 130.156 | 03770029 | -0.0268682 | 0.419483 | 150.911 |
| 1 | 03770026 | 0.321008 | 0.0716070 | 280.504 | 03770032 | -0.0229777 | 0.415593 | 247.256 |
| 2 | 03770027 | 0.353242 | 0.0393730 | 226.788 | 03770025 | 0.00000 | 0.392615 | 246.426 |
| 3 | 03770031 | 0.371317 | 0.0212980 | 182.874 | 03770028 | -0.0298869 | 0.422502 | 180.432 |