| Red | Green | Blue | |
| z | 17.64 | ||
| znorm | Inf | ||
| sky | -NaN | -Inf | -Inf |
| S/N | 25.0 | 41.9 | 47.5 |
| S/N(c) | 0.0 | 0.0 | 0.0 |
| SN(E/C) |
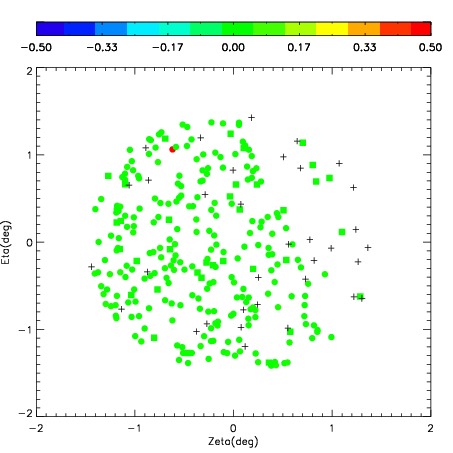

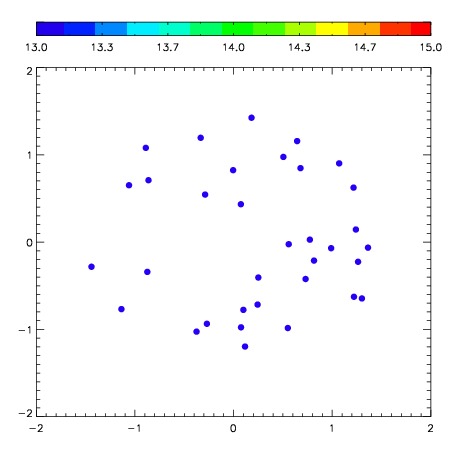
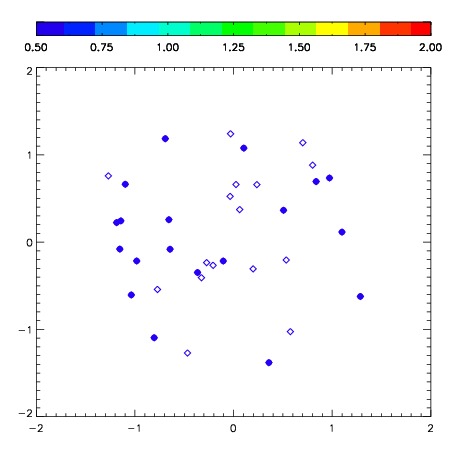
| Frame | Nreads | Zeropoints | Mag plots | Spatial mag deviation | Spatial sky 16325A emission deviations (filled: sky, open: star) | Spatial sky continuum emission | Spatial sky telluric CO2 absorption deviations (filled: H < 10) | |||||||||||||||||||||||
| 0 | 0 |
|
|
|
|
|
|
| IPAIR | NAME | SHIFT | NEWSHIFT | S/N | NAME | SHIFT | NEWSHIFT | S/N |
| 0 | 03980051 | 0.359443 | 0.00000 | 270.855 | 03980052 | 0.00772920 | 0.351714 | 292.452 |
| 1 | 03980047 | 0.340790 | 0.0186530 | 308.798 | 03980049 | 0.00811118 | 0.351332 | 304.276 |
| 2 | 03980050 | 0.348038 | 0.0114050 | 302.976 | 03980048 | 0.00645367 | 0.352989 | 301.793 |
| 3 | 03980046 | 0.355549 | 0.00389400 | 300.454 | 03980045 | 0.00000 | 0.359443 | 295.276 |