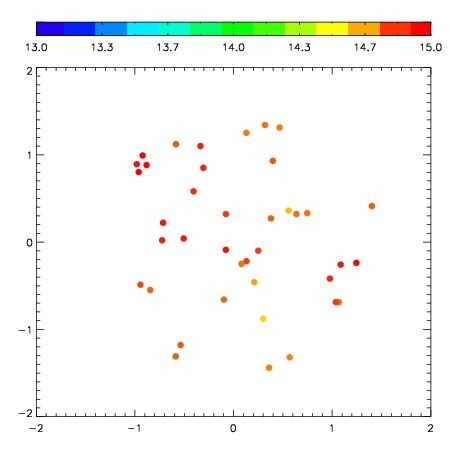
| Frame | Nreads | Zeropoints | Mag plots
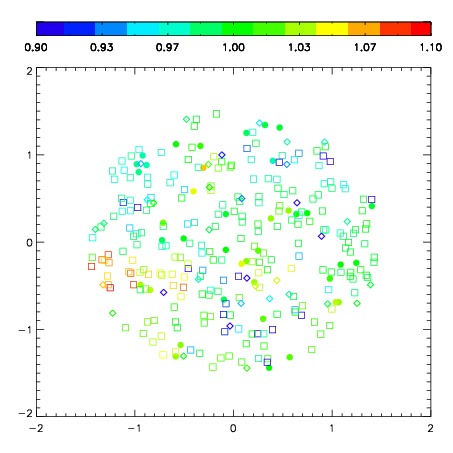
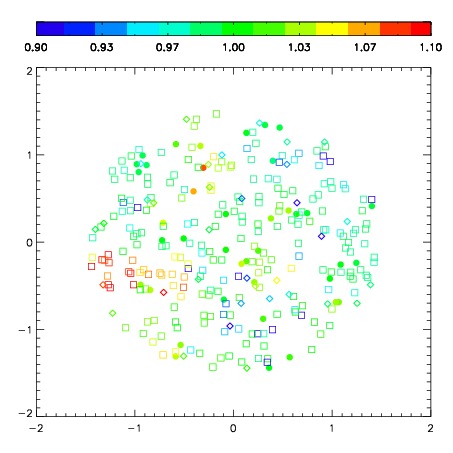
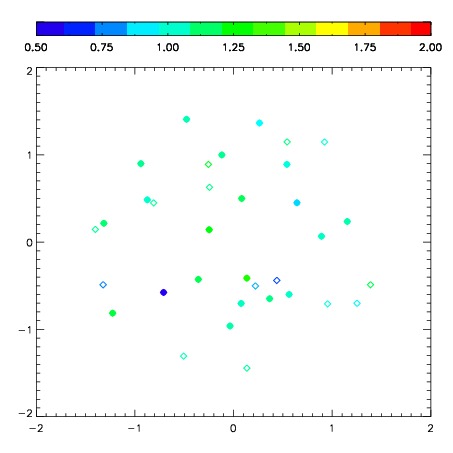
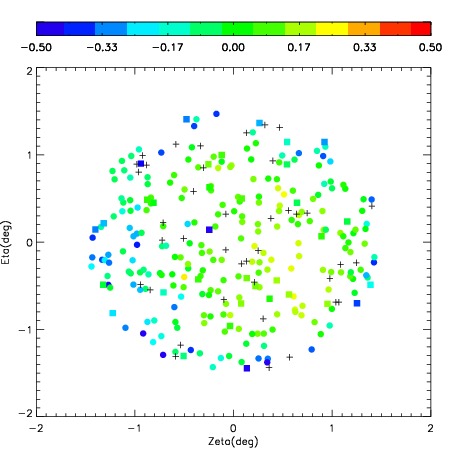
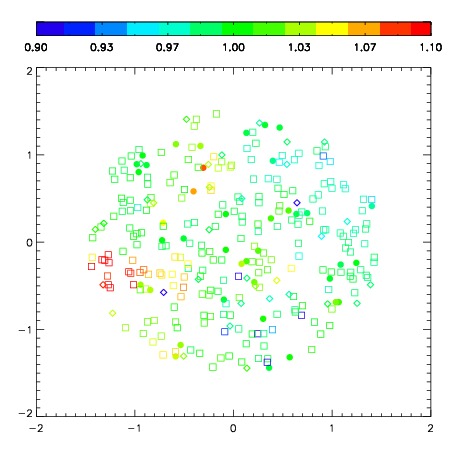
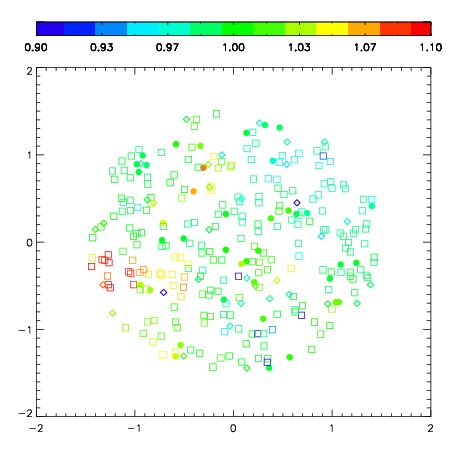
| Spatial mag deviation
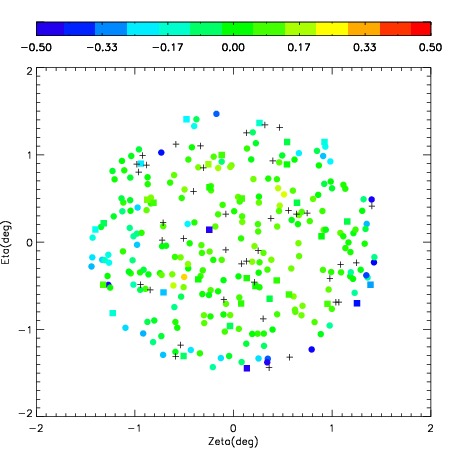
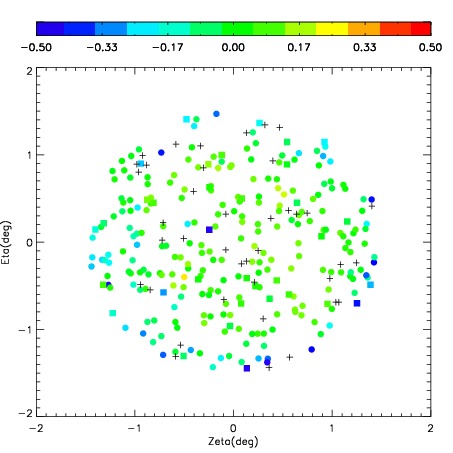
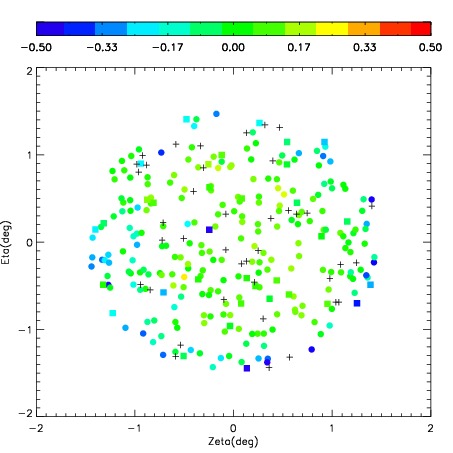
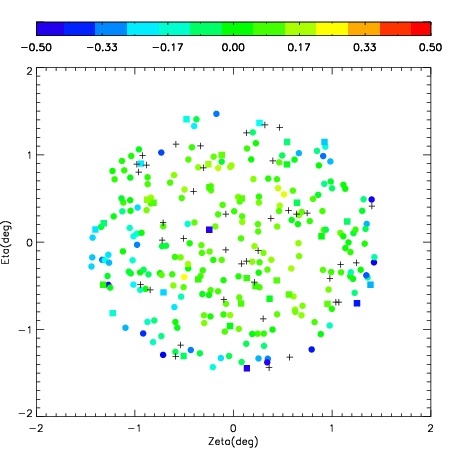
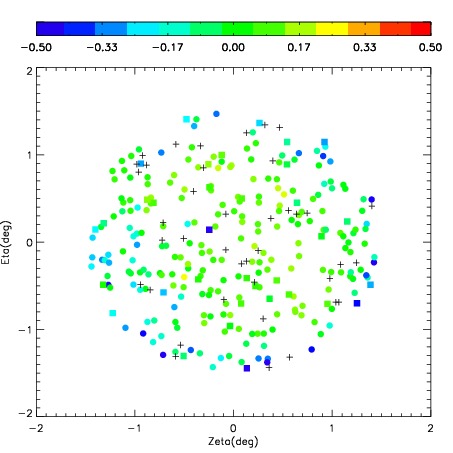
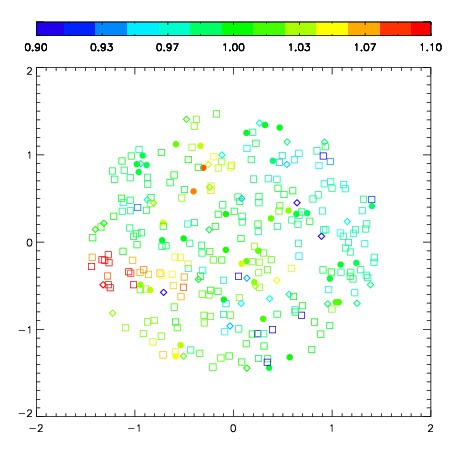
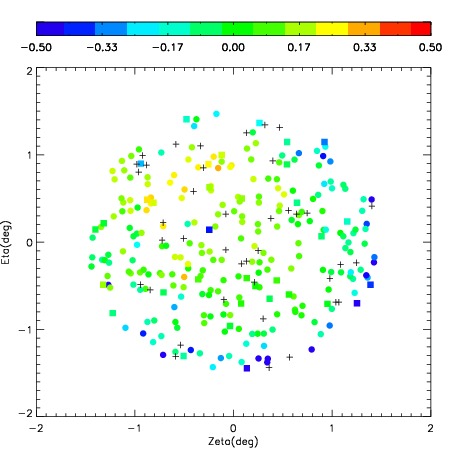
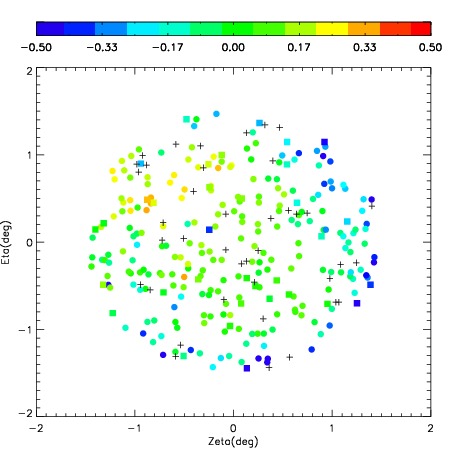
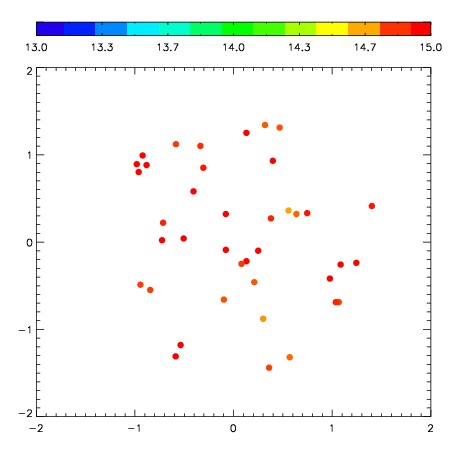
| Spatial sky 16325A emission deviations (filled: sky, open: star)
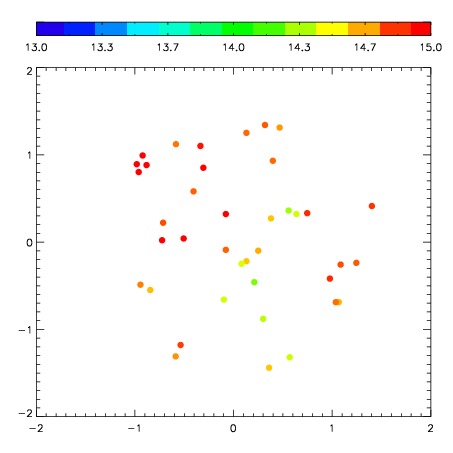
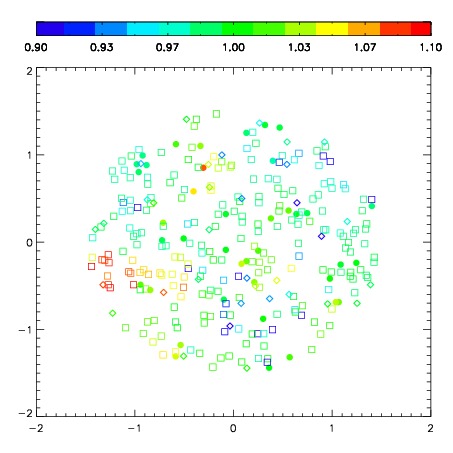
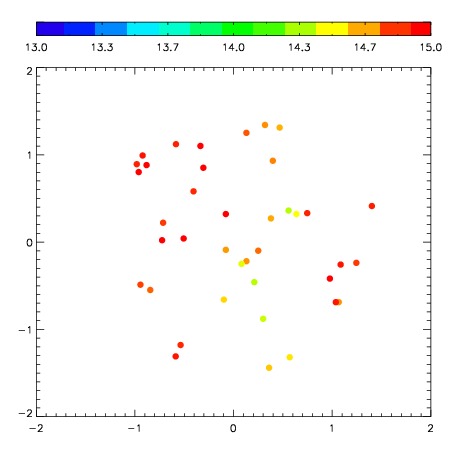
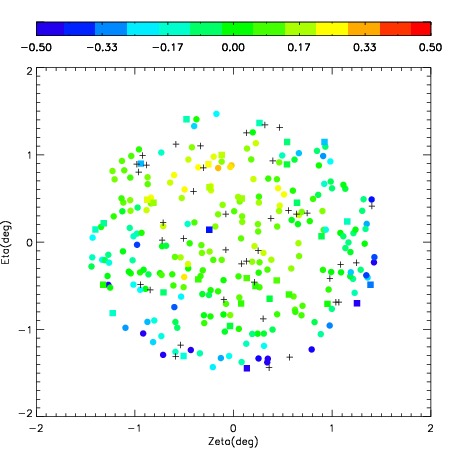
| Spatial sky continuum emission
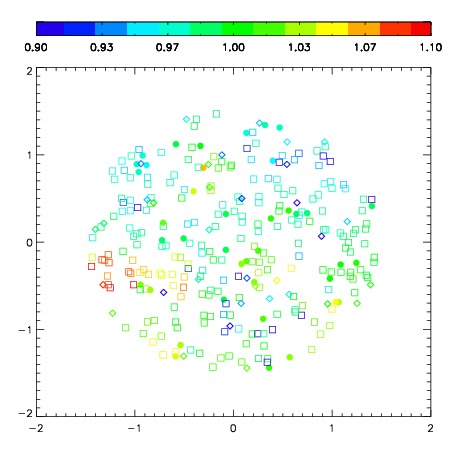
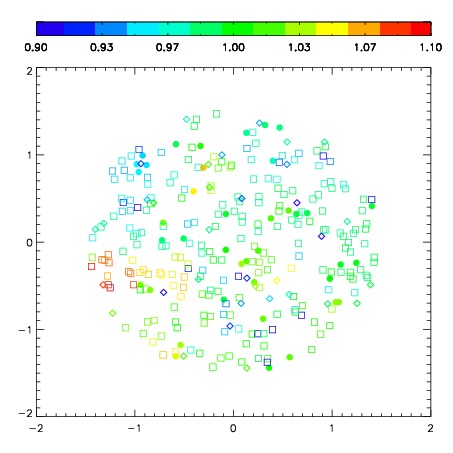
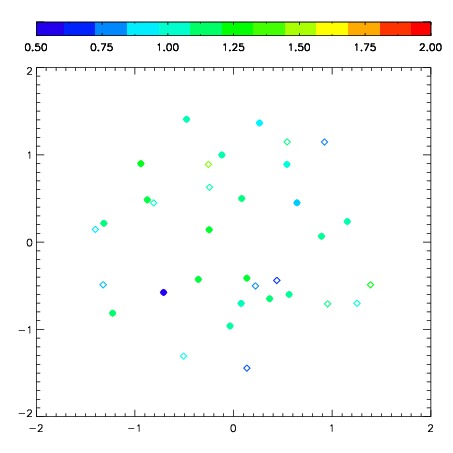
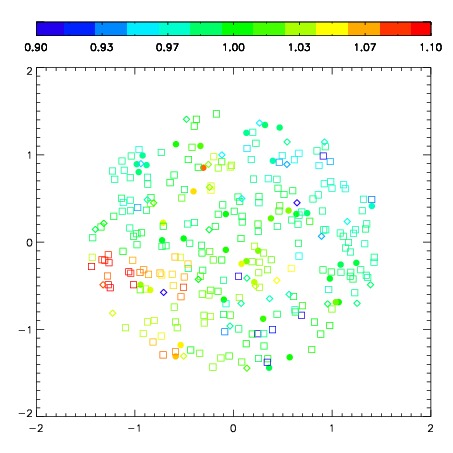
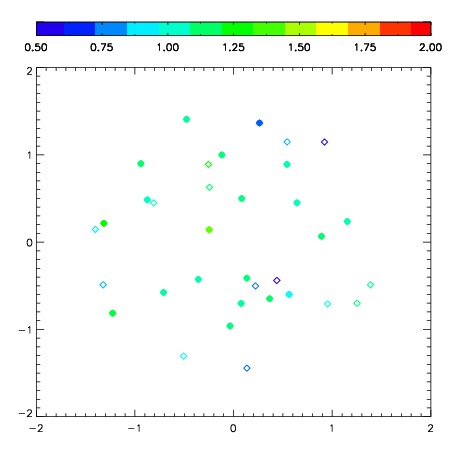
| Spatial sky telluric CO2 absorption deviations (filled: H < 10)
|
| 6950097
| 47
| | Red | Green | Blue
| | z | | 19.20
| | znorm | | 15.02
| | sky | 14.9 | 14.5 | 14.6
| | S/N | 18.7 | 29.0 | 30.7
| | S/N(c) | 16.3 | 27.2 | 28.9
| | SN(E/C) 0.91
|
| 
| 
| 
| 
| 
|
| 6950098
| 47
| | Red | Green | Blue
| | z | | 19.20
| | znorm | | 15.02
| | sky | 15.2 | 14.7 | 15.0
| | S/N | 18.7 | 29.2 | 31.1
| | S/N(c) | 16.1 | 26.8 | 29.0
| | SN(E/C) 0.91
|
| 
| 
| 
| 
| 
|
| 6950099
| 47
| | Red | Green | Blue
| | z | | 19.19
| | znorm | | 15.01
| | sky | 14.8 | 14.7 | 15.0
| | S/N | 18.7 | 29.2 | 31.6
| | S/N(c) | 16.1 | 26.8 | 28.6
| | SN(E/C) 0.88
|
| 
| 
| 
| 
| 
|
| 6950100
| 47
| | Red | Green | Blue
| | z | | 19.18
| | znorm | | 15.00
| | sky | 14.8 | 14.8 | 15.0
| | S/N | 18.2 | 28.9 | 31.2
| | S/N(c) | 15.9 | 26.7 | 28.7
| | SN(E/C) 0.93
|
| 
| 
| 
| 
| 
|
| 6950101
| 47
| | Red | Green | Blue
| | z | | 19.17
| | znorm | | 14.99
| | sky | 15.0 | 14.7 | 14.9
| | S/N | 18.1 | 28.8 | 30.6
| | S/N(c) | 16.0 | 26.3 | 28.1
| | SN(E/C) 0.89
|
| 
| 
| 
| 
| 
|
| 6950102
| 47
| | Red | Green | Blue
| | z | | 19.18
| | znorm | | 15.00
| | sky | 15.4 | 14.8 | 15.0
| | S/N | 18.5 | 28.9 | 30.9
| | S/N(c) | 15.8 | 26.3 | 28.1
| | SN(E/C) 0.93
|
| 
| 
| 
| 
| 
|
| 6950103
| 47
| | Red | Green | Blue
| | z | | 18.81
| | znorm | | 14.63
| | sky | 14.9 | 14.7 | 15.0
| | S/N | 14.1 | 24.0 | 25.7
| | S/N(c) | 12.0 | 21.7 | 23.1
| | SN(E/C) 0.96
|
| 
| 
| 
| 
| 
|
| 6950104
| 47
| | Red | Green | Blue
| | z | | 18.41
| | znorm | | 14.23
| | sky | 15.0 | 14.8 | 15.1
| | S/N | 11.2 | 18.6 | 20.0
| | S/N(c) | 9.2 | 16.1 | 17.9
| | SN(E/C) 0.99
|
| 
| 
| 
| 
| 
|
| 6950105
| 47
| | Red | Green | Blue
| | z | | 17.83
| | znorm | | 13.65
| | sky | 15.0 | 14.7 | 15.3
| | S/N | 7.3 | 13.2 | 14.3
| | S/N(c) | 5.8 | 11.6 | 12.4
| | SN(E/C) 0.96
|
| 
| 
| 
| 
| 
|
| 6950106
| 47
| | Red | Green | Blue
| | z | | 17.95
| | znorm | | 13.77
| | sky | 14.7 | 14.8 | 15.1
| | S/N | 7.8 | 14.0 | 14.9
| | S/N(c) | 6.4 | 12.1 | 13.0
| | SN(E/C) 0.99
|
| 
| 
| 
| 
| 
|