| Red | Green | Blue | |
| z | 17.64 | ||
| znorm | Inf | ||
| sky | -NaN | -NaN | -Inf |
| S/N | 32.4 | 55.2 | 63.6 |
| S/N(c) | 0.0 | 0.0 | 0.0 |
| SN(E/C) |

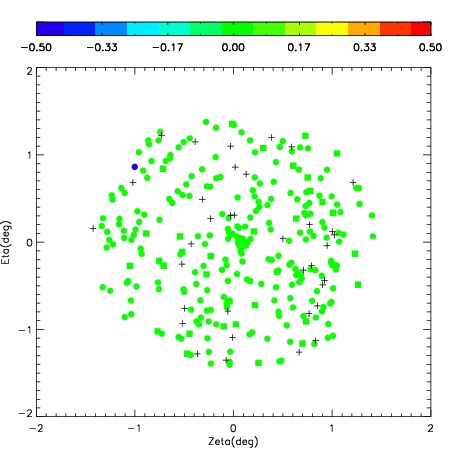
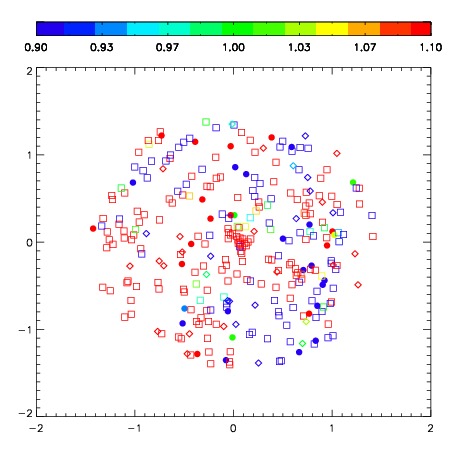
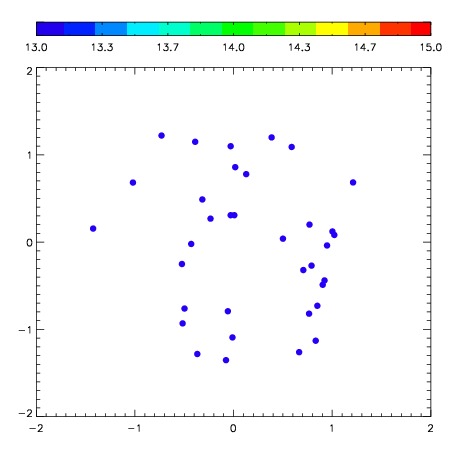
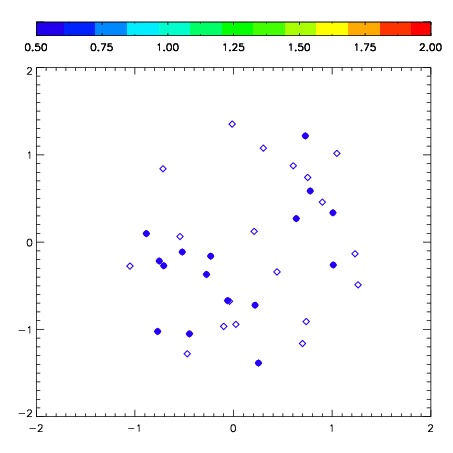
| Frame | Nreads | Zeropoints | Mag plots | Spatial mag deviation | Spatial sky 16325A emission deviations (filled: sky, open: star) | Spatial sky continuum emission | Spatial sky telluric CO2 absorption deviations (filled: H < 10) | |||||||||||||||||||||||
| 0 | 0 |
|
|
|
|
|
|
| IPAIR | NAME | SHIFT | NEWSHIFT | S/N | NAME | SHIFT | NEWSHIFT | S/N |
| 0 | 06940104 | 0.533611 | 0.00000 | 310.358 | 06940106 | 0.0550001 | 0.478611 | 311.952 |
| 1 | 06940107 | 0.523880 | 0.00973099 | 312.519 | 06940109 | 0.0576929 | 0.475918 | 312.353 |
| 2 | 06940108 | 0.530165 | 0.00344598 | 312.305 | 06940105 | 0.0512386 | 0.482372 | 312.270 |
| 3 | 06940103 | 0.523733 | 0.00987798 | 310.227 | 06940098 | 0.00000 | 0.533611 | 310.188 |
| 4 | 06940099 | 0.528828 | 0.00478297 | 310.072 | 06940102 | 0.0497784 | 0.483833 | 308.641 |
| 5 | 06940100 | 0.524239 | 0.00937200 | 309.162 | 06940101 | 0.0536183 | 0.479993 | 306.804 |