| Red | Green | Blue | |
| z | 17.64 | ||
| znorm | Inf | ||
| sky | -Inf | -Inf | -Inf |
| S/N | 25.0 | 46.7 | 52.6 |
| S/N(c) | 0.0 | 0.0 | 0.0 |
| SN(E/C) |
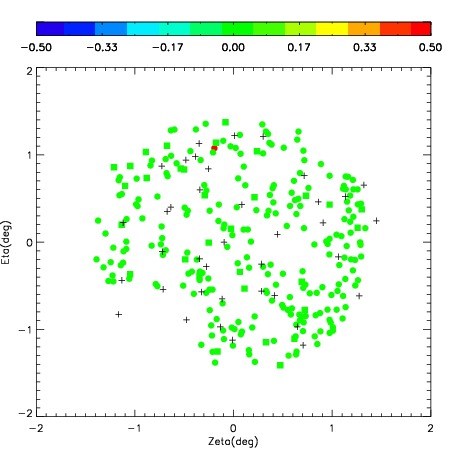


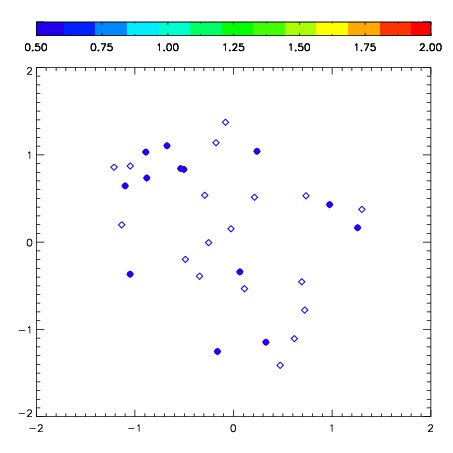
| Frame | Nreads | Zeropoints | Mag plots | Spatial mag deviation | Spatial sky 16325A emission deviations (filled: sky, open: star) | Spatial sky continuum emission | Spatial sky telluric CO2 absorption deviations (filled: H < 10) | |||||||||||||||||||||||
| 0 | 0 |
|
|
|
|
|
|
| IPAIR | NAME | SHIFT | NEWSHIFT | S/N | NAME | SHIFT | NEWSHIFT | S/N |
| 0 | 03690081 | 0.492390 | 0.00000 | 140.934 | 03690083 | 0.0198596 | 0.472530 | 151.906 |
| 1 | 03690090 | 0.488887 | 0.00350299 | 196.146 | 03690091 | 0.0187550 | 0.473635 | 203.971 |
| 2 | 03690089 | 0.487926 | 0.00446400 | 187.086 | 03690088 | 0.0185164 | 0.473874 | 188.725 |
| 3 | 03690086 | 0.489897 | 0.00249299 | 182.822 | 03690087 | 0.0171935 | 0.475197 | 184.610 |
| 4 | 03690085 | 0.489078 | 0.00331202 | 174.725 | 03690084 | 0.0145074 | 0.477883 | 155.218 |
| 5 | 03690082 | 0.492111 | 0.000279009 | 137.358 | 03690080 | 0.00000 | 0.492390 | 135.173 |