| Red | Green | Blue | |
| z | 17.64 | ||
| znorm | Inf | ||
| sky | -Inf | -Inf | -Inf |
| S/N | 22.3 | 40.7 | 45.0 |
| S/N(c) | 0.0 | 0.0 | 0.0 |
| SN(E/C) |


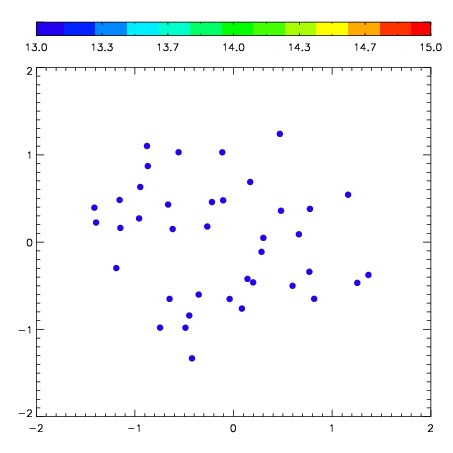
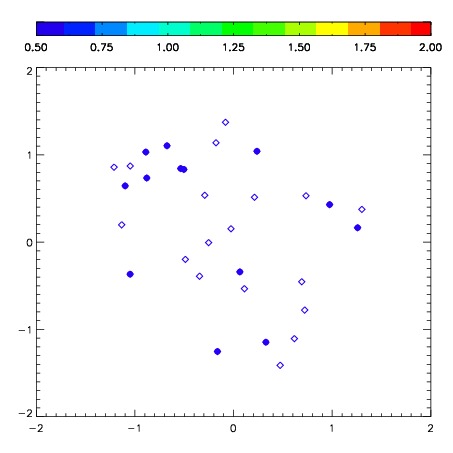
| Frame | Nreads | Zeropoints | Mag plots | Spatial mag deviation | Spatial sky 16325A emission deviations (filled: sky, open: star) | Spatial sky continuum emission | Spatial sky telluric CO2 absorption deviations (filled: H < 10) | |||||||||||||||||||||||
| 0 | 0 |
|
|
|
|
|
|
| IPAIR | NAME | SHIFT | NEWSHIFT | S/N | NAME | SHIFT | NEWSHIFT | S/N |
| 0 | 03740040 | 0.467882 | 0.00000 | 213.894 | 03740041 | 0.0224653 | 0.445417 | 204.762 |
| 1 | 03740039 | 0.462191 | 0.00569102 | 210.769 | 03740038 | 0.0207648 | 0.447117 | 203.904 |
| 2 | 03740036 | 0.465424 | 0.00245801 | 186.074 | 03740037 | 0.0174857 | 0.450396 | 201.883 |
| 3 | 03740035 | 0.465543 | 0.00233901 | 175.558 | 03740034 | 0.00000 | 0.467882 | 170.032 |