| Red | Green | Blue | |
| z | 17.64 | ||
| znorm | Inf | ||
| sky | -NaN | -Inf | -Inf |
| S/N | 31.8 | 57.3 | 63.3 |
| S/N(c) | 0.0 | 0.0 | 0.0 |
| SN(E/C) |
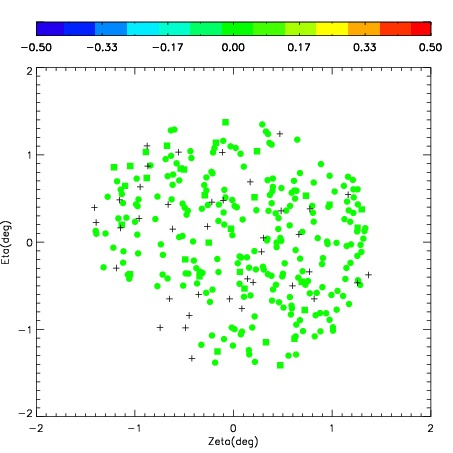

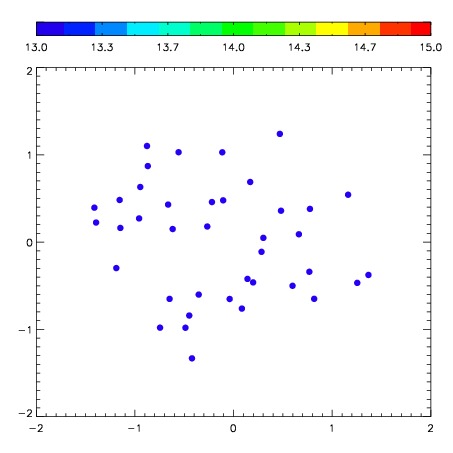
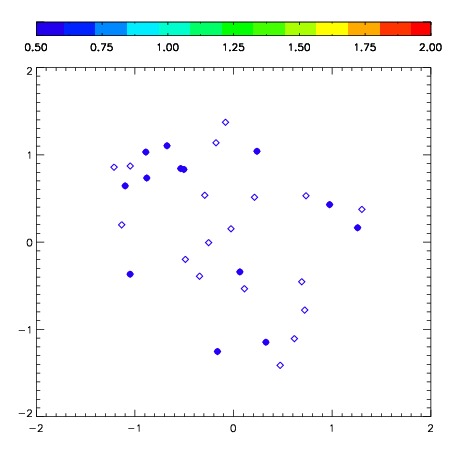
| Frame | Nreads | Zeropoints | Mag plots | Spatial mag deviation | Spatial sky 16325A emission deviations (filled: sky, open: star) | Spatial sky continuum emission | Spatial sky telluric CO2 absorption deviations (filled: H < 10) | |||||||||||||||||||||||
| 0 | 0 |
|
|
|
|
|
|
| IPAIR | NAME | SHIFT | NEWSHIFT | S/N | NAME | SHIFT | NEWSHIFT | S/N |
| 0 | 04030078 | 0.336138 | 0.00000 | 227.673 | 04030073 | 0.00000 | 0.336138 | 223.363 |
| 1 | 04030083 | 0.319402 | 0.0167360 | 244.418 | 04030084 | -0.0618270 | 0.397965 | 240.448 |
| 2 | 04030082 | 0.324767 | 0.0113710 | 241.626 | 04030081 | -0.0524696 | 0.388608 | 240.046 |
| 3 | 04030079 | 0.323725 | 0.0124130 | 230.708 | 04030080 | -0.0617124 | 0.397850 | 233.788 |
| 4 | 04030074 | 0.323089 | 0.0130490 | 215.444 | 04030077 | -0.0611311 | 0.397269 | 222.810 |
| 5 | 04030075 | 0.323950 | 0.0121880 | 212.970 | 04030076 | -0.0644035 | 0.400542 | 219.760 |