| Red | Green | Blue | |
| z | 17.64 | ||
| znorm | Inf | ||
| sky | -Inf | -Inf | -Inf |
| S/N | 24.9 | 42.7 | 44.9 |
| S/N(c) | 0.0 | 0.0 | 0.0 |
| SN(E/C) |

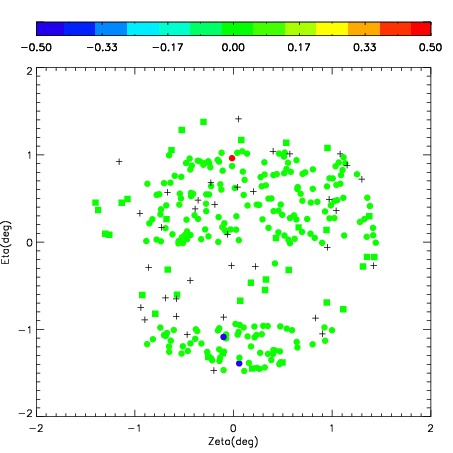
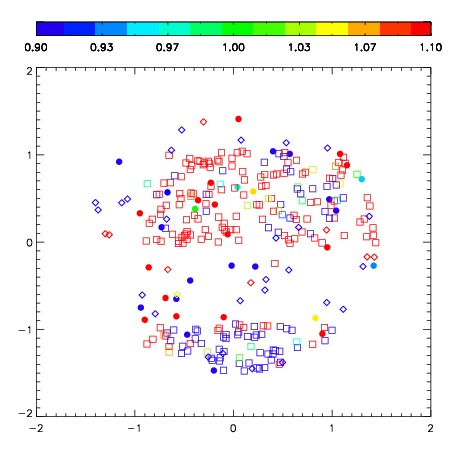


| Frame | Nreads | Zeropoints | Mag plots | Spatial mag deviation | Spatial sky 16325A emission deviations (filled: sky, open: star) | Spatial sky continuum emission | Spatial sky telluric CO2 absorption deviations (filled: H < 10) | |||||||||||||||||||||||
| 0 | 0 |
|
|
|
|
|
|
| IPAIR | NAME | SHIFT | NEWSHIFT | S/N | NAME | SHIFT | NEWSHIFT | S/N |
| 0 | 04360027 | 0.410463 | 0.00000 | 226.342 | 04360024 | 0.0112401 | 0.399223 | 202.713 |
| 1 | 04360026 | 0.396393 | 0.0140700 | 229.893 | 04360028 | 0.00792086 | 0.402542 | 229.760 |
| 2 | 04360023 | 0.394966 | 0.0154970 | 226.406 | 04360021 | 0.00000 | 0.410463 | 221.234 |
| 3 | 04360022 | 0.401172 | 0.00929099 | 211.367 | 04360025 | 0.00322205 | 0.407241 | 199.773 |