| Red | Green | Blue | |
| z | 17.64 | ||
| znorm | Inf | ||
| sky | -NaN | -NaN | -Inf |
| S/N | 25.3 | 44.3 | 49.0 |
| S/N(c) | 0.0 | 0.0 | 0.0 |
| SN(E/C) |


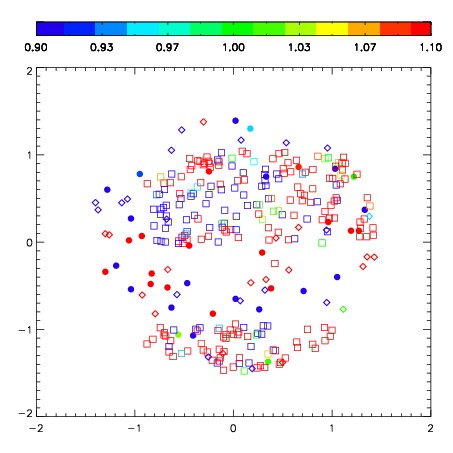
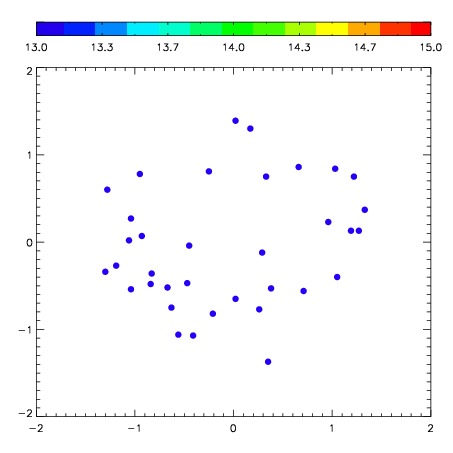
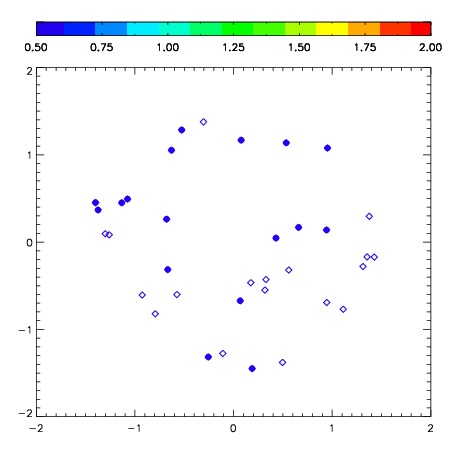
| Frame | Nreads | Zeropoints | Mag plots | Spatial mag deviation | Spatial sky 16325A emission deviations (filled: sky, open: star) | Spatial sky continuum emission | Spatial sky telluric CO2 absorption deviations (filled: H < 10) | |||||||||||||||||||||||
| 0 | 0 |
|
|
|
|
|
|
| IPAIR | NAME | SHIFT | NEWSHIFT | S/N | NAME | SHIFT | NEWSHIFT | S/N |
| 0 | 07520083 | 0.585950 | 0.00000 | 211.815 | 07520082 | 0.160561 | 0.425389 | 209.714 |
| 1 | 07520084 | 0.574014 | 0.0119360 | 214.802 | 07520085 | 0.172470 | 0.413480 | 211.410 |
| 2 | 07520080 | 0.566453 | 0.0194970 | 210.312 | 07520078 | 0.00000 | 0.585950 | 206.104 |
| 3 | 07520079 | 0.566462 | 0.0194880 | 207.871 | 07520081 | 0.159259 | 0.426691 | 203.645 |