| Red | Green | Blue | |
| z | 17.64 | ||
| znorm | Inf | ||
| sky | -Inf | -Inf | -Inf |
| S/N | 15.4 | 27.7 | 36.2 |
| S/N(c) | 0.0 | 0.0 | 0.0 |
| SN(E/C) |


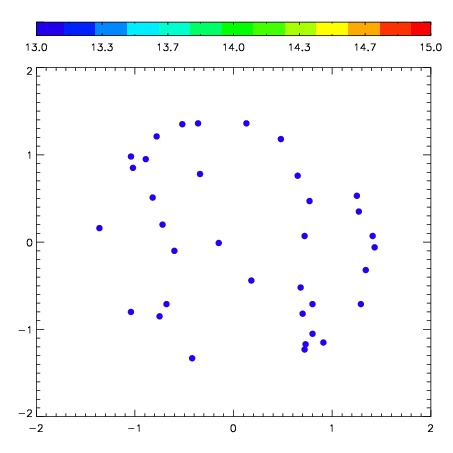
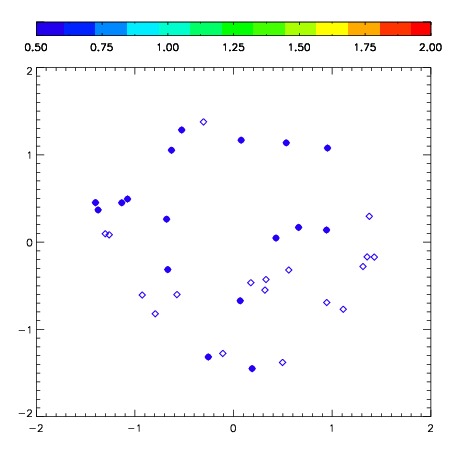
| Frame | Nreads | Zeropoints | Mag plots | Spatial mag deviation | Spatial sky 16325A emission deviations (filled: sky, open: star) | Spatial sky continuum emission | Spatial sky telluric CO2 absorption deviations (filled: H < 10) | |||||||||||||||||||||||
| 0 | 0 |
|
|
|
|
|
|
| IPAIR | NAME | SHIFT | NEWSHIFT | S/N | NAME | SHIFT | NEWSHIFT | S/N |
| 0 | 07900039 | 0.390389 | 0.00000 | 143.105 | 07900040 | -0.0155876 | 0.405977 | 140.903 |
| 1 | 07900043 | 0.381460 | 0.00892898 | 182.327 | 07900044 | -0.00652701 | 0.396916 | 183.551 |
| 2 | 07900042 | 0.375412 | 0.0149770 | 179.516 | 07900041 | -0.0111251 | 0.401514 | 162.662 |
| 3 | 07900038 | 0.384887 | 0.00550199 | 129.084 | 07900037 | 0.00000 | 0.390389 | 117.261 |