| Red | Green | Blue | |
| z | 17.64 | ||
| znorm | Inf | ||
| sky | -NaN | -Inf | -Inf |
| S/N | 25.7 | 43.2 | 52.6 |
| S/N(c) | 0.0 | 0.0 | 0.0 |
| SN(E/C) |
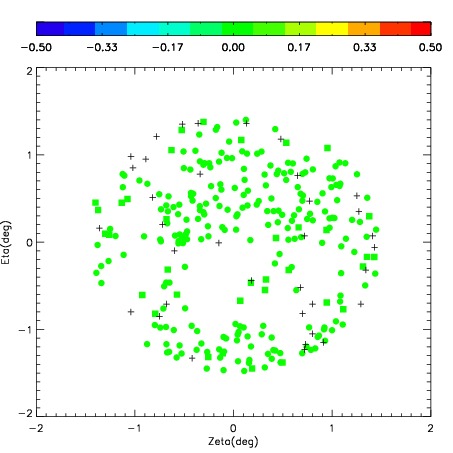
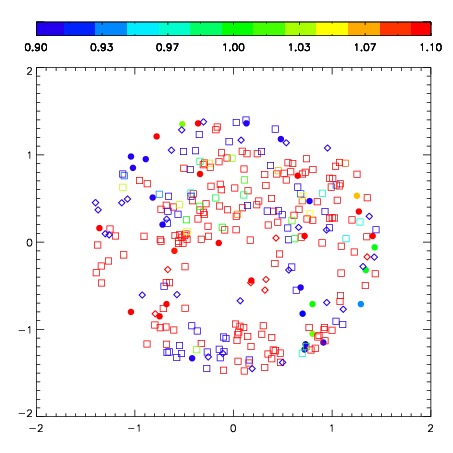


| Frame | Nreads | Zeropoints | Mag plots | Spatial mag deviation | Spatial sky 16325A emission deviations (filled: sky, open: star) | Spatial sky continuum emission | Spatial sky telluric CO2 absorption deviations (filled: H < 10) | |||||||||||||||||||||||
| 0 | 0 |
|
|
|
|
|
|
| IPAIR | NAME | SHIFT | NEWSHIFT | S/N | NAME | SHIFT | NEWSHIFT | S/N |
| 0 | 08190027 | 0.543216 | 0.00000 | 198.448 | 08190028 | 0.0489348 | 0.494281 | 196.544 |
| 1 | 08190031 | 0.537859 | 0.00535697 | 219.182 | 08190025 | 0.00000 | 0.543216 | 218.368 |
| 2 | 08190026 | 0.534864 | 0.00835198 | 210.888 | 08190032 | 0.0502338 | 0.492982 | 215.335 |
| 3 | 08190030 | 0.539450 | 0.00376600 | 191.457 | 08190029 | 0.0420523 | 0.501164 | 177.349 |