| Red | Green | Blue | |
| z | 17.64 | ||
| znorm | Inf | ||
| sky | -Inf | -NaN | -Inf |
| S/N | 27.6 | 45.2 | 49.6 |
| S/N(c) | 0.0 | 0.0 | 0.0 |
| SN(E/C) |

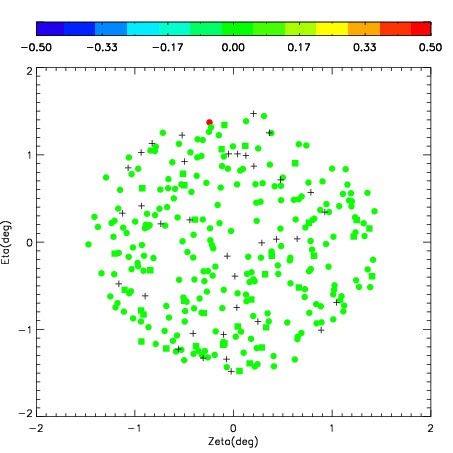
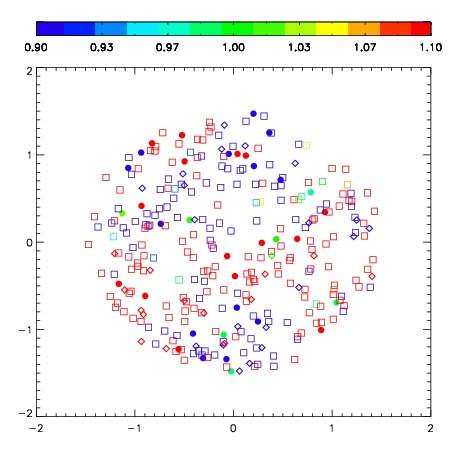


| Frame | Nreads | Zeropoints | Mag plots | Spatial mag deviation | Spatial sky 16325A emission deviations (filled: sky, open: star) | Spatial sky continuum emission | Spatial sky telluric CO2 absorption deviations (filled: H < 10) | |||||||||||||||||||||||
| 0 | 0 |
|
|
|
|
|
|
| IPAIR | NAME | SHIFT | NEWSHIFT | S/N | NAME | SHIFT | NEWSHIFT | S/N |
| 0 | 03650017 | 0.463895 | 0.00000 | 265.888 | 03650018 | 0.00893360 | 0.454961 | 268.860 |
| 1 | 03650016 | 0.462236 | 0.00165901 | 264.021 | 03650022 | 0.00989096 | 0.454004 | 262.827 |
| 2 | 03650020 | 0.459774 | 0.00412101 | 263.692 | 03650019 | 0.00815305 | 0.455742 | 262.495 |
| 3 | 03650021 | 0.460190 | 0.00370499 | 260.315 | 03650015 | 0.00000 | 0.463895 | 261.275 |