| Red | Green | Blue | |
| z | 17.64 | ||
| znorm | Inf | ||
| sky | -NaN | -NaN | -Inf |
| S/N | 23.7 | 39.2 | 41.9 |
| S/N(c) | 0.0 | 0.0 | 0.0 |
| SN(E/C) |

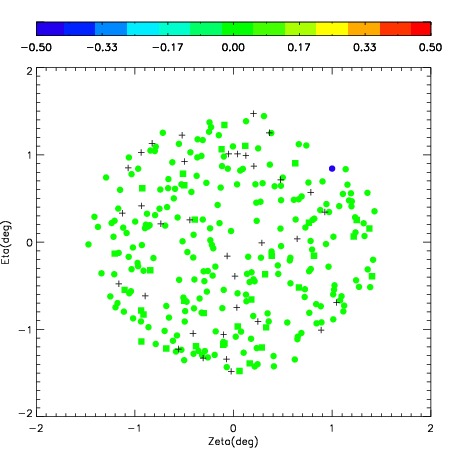
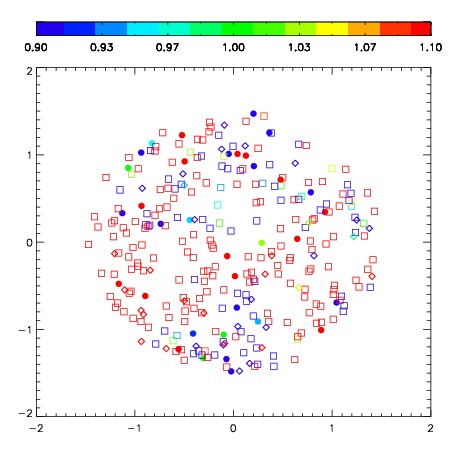
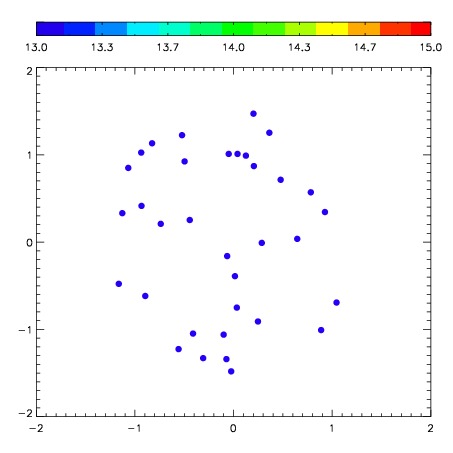

| Frame | Nreads | Zeropoints | Mag plots | Spatial mag deviation | Spatial sky 16325A emission deviations (filled: sky, open: star) | Spatial sky continuum emission | Spatial sky telluric CO2 absorption deviations (filled: H < 10) | |||||||||||||||||||||||
| 0 | 0 |
|
|
|
|
|
|
| IPAIR | NAME | SHIFT | NEWSHIFT | S/N | NAME | SHIFT | NEWSHIFT | S/N |
| 0 | 03690014 | 0.405525 | 0.00000 | 261.313 | 03690012 | 0.00566158 | 0.399863 | 263.730 |
| 1 | 03690013 | 0.397890 | 0.00763500 | 261.658 | 03690011 | 0.00786722 | 0.397658 | 265.256 |
| 2 | 03690009 | 0.399854 | 0.00567099 | 251.563 | 03690008 | 0.00000 | 0.405525 | 261.923 |
| 3 | 03690010 | 0.398883 | 0.00664201 | 251.274 | 03690015 | 0.00742920 | 0.398096 | 253.222 |