| Red | Green | Blue | |
| z | 17.64 | ||
| znorm | Inf | ||
| sky | -Inf | -NaN | -Inf |
| S/N | 29.1 | 46.8 | 51.6 |
| S/N(c) | 0.0 | 0.0 | 0.0 |
| SN(E/C) |

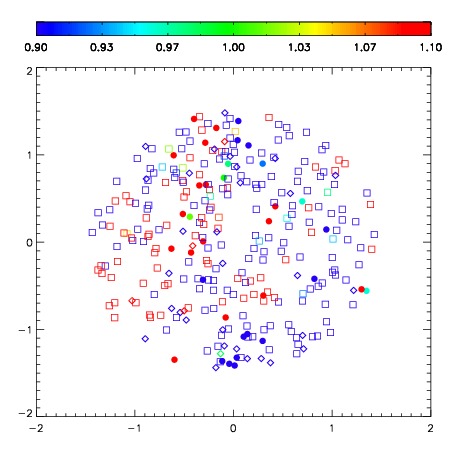
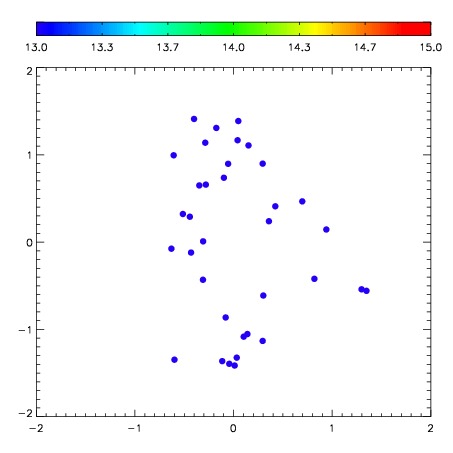
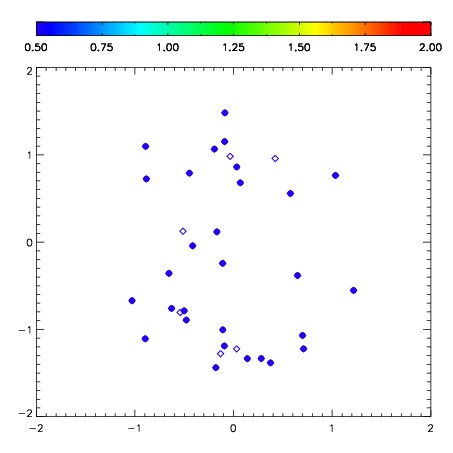
| Frame | Nreads | Zeropoints | Mag plots | Spatial mag deviation | Spatial sky 16325A emission deviations (filled: sky, open: star) | Spatial sky continuum emission | Spatial sky telluric CO2 absorption deviations (filled: H < 10) | |||||||||||||||||||||||
| 0 | 0 |
|
|
|
|
|
|
| IPAIR | NAME | SHIFT | NEWSHIFT | S/N | NAME | SHIFT | NEWSHIFT | S/N |
| 0 | 09720041 | 0.374370 | 0.00000 | 260.656 | 09720039 | 0.00741823 | 0.366952 | 255.061 |
| 1 | 09720042 | 0.374095 | 0.000275016 | 261.006 | 09720043 | 0.00962660 | 0.364743 | 259.993 |
| 2 | 09720037 | 0.363792 | 0.0105780 | 257.211 | 09720036 | 0.00000 | 0.374370 | 254.725 |
| 3 | 09720038 | 0.370867 | 0.00350299 | 245.739 | 09720040 | 0.0121147 | 0.362255 | 251.280 |