| Red | Green | Blue | |
| z | 17.64 | ||
| znorm | Inf | ||
| sky | -Inf | -Inf | -Inf |
| S/N | 23.0 | 38.9 | 45.4 |
| S/N(c) | 0.0 | 0.0 | 0.0 |
| SN(E/C) |

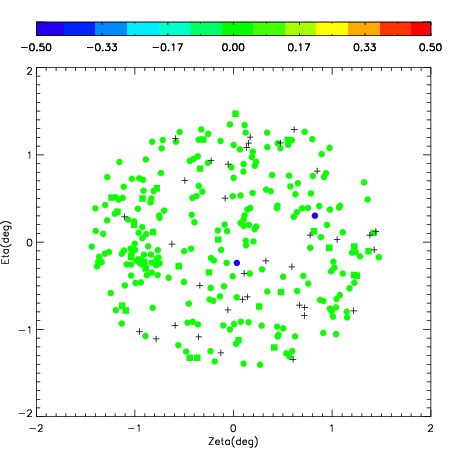
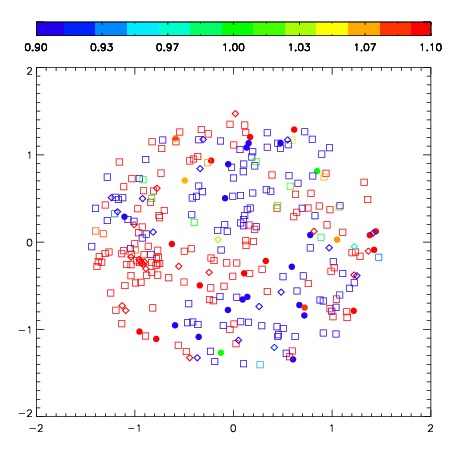

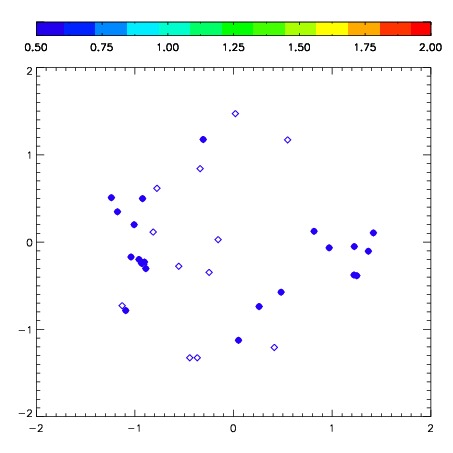
| Frame | Nreads | Zeropoints | Mag plots | Spatial mag deviation | Spatial sky 16325A emission deviations (filled: sky, open: star) | Spatial sky continuum emission | Spatial sky telluric CO2 absorption deviations (filled: H < 10) | |||||||||||||||||||||||
| 0 | 0 |
|
|
|
|
|
|
| IPAIR | NAME | SHIFT | NEWSHIFT | S/N | NAME | SHIFT | NEWSHIFT | S/N |
| 0 | 06980032 | 0.472014 | 0.00000 | 226.793 | 06980029 | 0.0246164 | 0.447398 | 245.428 |
| 1 | 06980027 | 0.465377 | 0.00663701 | 280.184 | 06980026 | 0.00000 | 0.472014 | 274.279 |
| 2 | 06980028 | 0.464723 | 0.00729102 | 264.299 | 06980033 | 0.0242654 | 0.447749 | 273.161 |
| 3 | 06980031 | 0.471074 | 0.000940025 | 234.856 | 06980030 | 0.0247682 | 0.447246 | 245.770 |