| Red | Green | Blue | |
| z | 17.64 | ||
| znorm | Inf | ||
| sky | -Inf | -Inf | -Inf |
| S/N | 18.9 | 32.9 | 35.2 |
| S/N(c) | 0.0 | 0.0 | 0.0 |
| SN(E/C) |


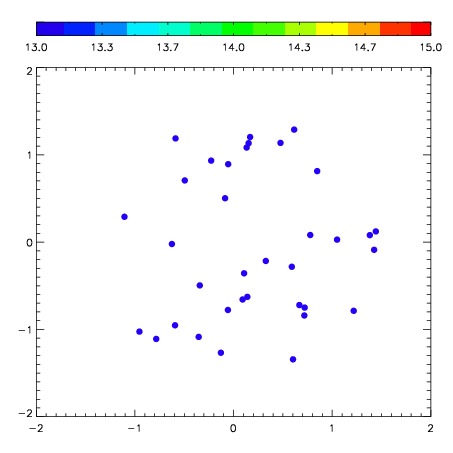
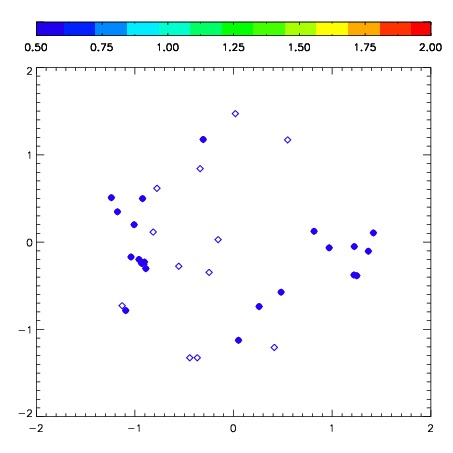
| Frame | Nreads | Zeropoints | Mag plots | Spatial mag deviation | Spatial sky 16325A emission deviations (filled: sky, open: star) | Spatial sky continuum emission | Spatial sky telluric CO2 absorption deviations (filled: H < 10) | |||||||||||||||||||||||
| 0 | 0 |
|
|
|
|
|
|
| IPAIR | NAME | SHIFT | NEWSHIFT | S/N | NAME | SHIFT | NEWSHIFT | S/N |
| 0 | 07210012 | 0.534270 | 0.00000 | 199.848 | 07210011 | 0.00000 | 0.534270 | 161.742 |
| 1 | 07210017 | 0.520277 | 0.0139930 | 267.416 | 07210018 | 0.0833473 | 0.450923 | 262.841 |
| 2 | 07210016 | 0.521675 | 0.0125950 | 261.596 | 07210015 | 0.0830805 | 0.451189 | 244.155 |
| 3 | 07210013 | 0.524559 | 0.00971097 | 244.027 | 07210014 | 0.0877573 | 0.446513 | 232.585 |