| Red | Green | Blue | |
| z | 17.64 | ||
| znorm | Inf | ||
| sky | -NaN | -Inf | -Inf |
| S/N | 13.6 | 23.4 | 26.3 |
| S/N(c) | 0.0 | 0.0 | 0.0 |
| SN(E/C) |


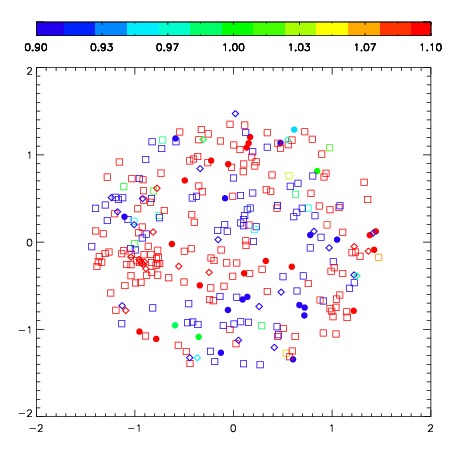
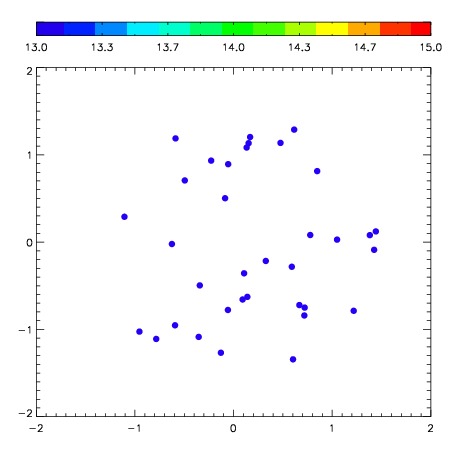
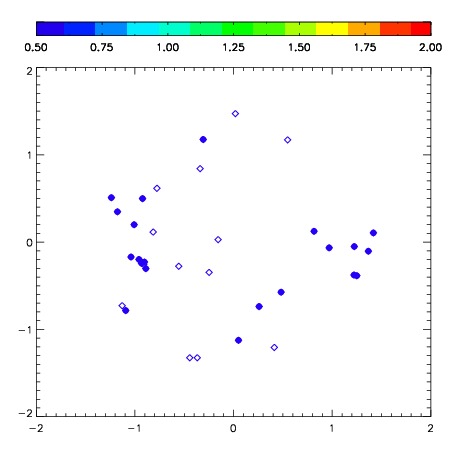
| Frame | Nreads | Zeropoints | Mag plots | Spatial mag deviation | Spatial sky 16325A emission deviations (filled: sky, open: star) | Spatial sky continuum emission | Spatial sky telluric CO2 absorption deviations (filled: H < 10) | |||||||||||||||||||||||
| 0 | 0 |
|
|
|
|
|
|
| IPAIR | NAME | SHIFT | NEWSHIFT | S/N | NAME | SHIFT | NEWSHIFT | S/N |
| 0 | 07260018 | 0.555965 | 0.00000 | 200.307 | 07260016 | 0.0956647 | 0.460300 | 216.660 |
| 1 | 07260017 | 0.552199 | 0.00376600 | 209.455 | 07260012 | 0.00000 | 0.555965 | 253.329 |
| 2 | 07260013 | 0.549205 | 0.00676000 | 159.793 | 07260015 | 0.0990441 | 0.456921 | 185.652 |
| 3 | 07260014 | 0.549034 | 0.00693101 | 151.153 | 07260019 | 0.116453 | 0.439512 | 153.345 |