| Red | Green | Blue | |
| z | 17.64 | ||
| znorm | Inf | ||
| sky | -Inf | -Inf | -Inf |
| S/N | 23.4 | 41.2 | 44.3 |
| S/N(c) | 0.0 | 0.0 | 0.0 |
| SN(E/C) |
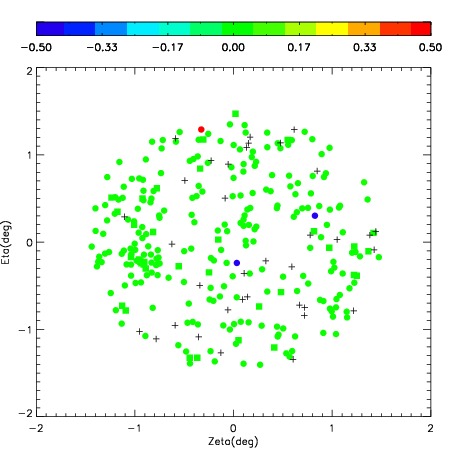

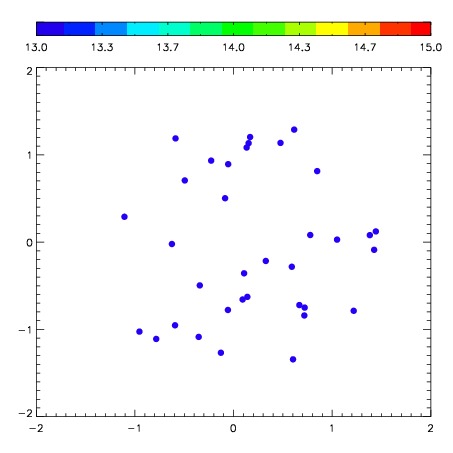
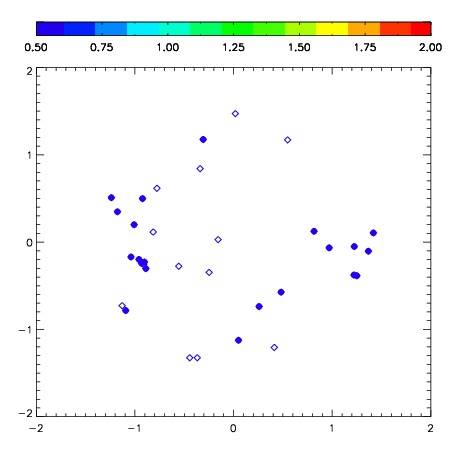
| Frame | Nreads | Zeropoints | Mag plots | Spatial mag deviation | Spatial sky 16325A emission deviations (filled: sky, open: star) | Spatial sky continuum emission | Spatial sky telluric CO2 absorption deviations (filled: H < 10) | |||||||||||||||||||||||
| 0 | 0 |
|
|
|
|
|
|
| IPAIR | NAME | SHIFT | NEWSHIFT | S/N | NAME | SHIFT | NEWSHIFT | S/N |
| 0 | 07280013 | 0.486348 | 0.00000 | 268.353 | 07280014 | 0.0739693 | 0.412379 | 274.510 |
| 1 | 07280017 | 0.470542 | 0.0158060 | 289.430 | 07280018 | 0.0675972 | 0.418751 | 294.874 |
| 2 | 07280016 | 0.476537 | 0.00981101 | 284.095 | 07280015 | 0.0703049 | 0.416043 | 280.345 |
| 3 | 07280012 | 0.480067 | 0.00628099 | 267.811 | 07280011 | 0.00000 | 0.486348 | 264.872 |