| Red | Green | Blue | |
| z | 17.64 | ||
| znorm | Inf | ||
| sky | -NaN | -Inf | -Inf |
| S/N | 24.6 | 43.5 | 50.0 |
| S/N(c) | 0.0 | 0.0 | 0.0 |
| SN(E/C) |


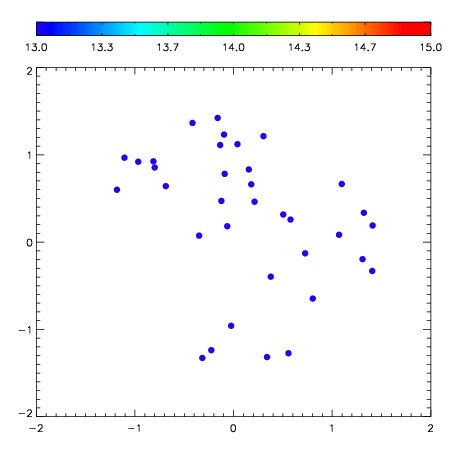
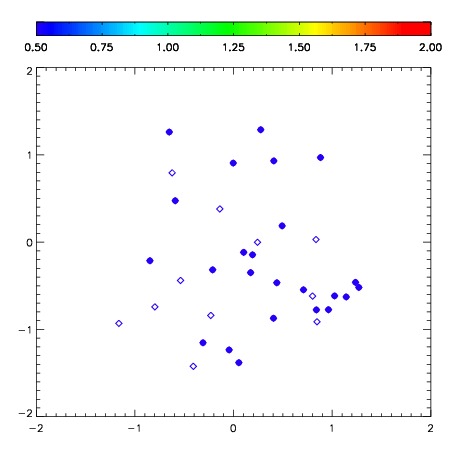
| Frame | Nreads | Zeropoints | Mag plots | Spatial mag deviation | Spatial sky 16325A emission deviations (filled: sky, open: star) | Spatial sky continuum emission | Spatial sky telluric CO2 absorption deviations (filled: H < 10) | |||||||||||||||||||||||
| 0 | 0 |
|
|
|
|
|
|
| IPAIR | NAME | SHIFT | NEWSHIFT | S/N | NAME | SHIFT | NEWSHIFT | S/N |
| 0 | 09970068 | 0.481398 | 0.00000 | 122.181 | 09970073 | 0.0221311 | 0.459267 | 110.348 |
| 1 | 09970071 | 0.474716 | 0.00668198 | 124.664 | 09970070 | 0.0228826 | 0.458515 | 122.592 |
| 2 | 09970072 | 0.477320 | 0.00407800 | 124.551 | 09970066 | 0.00000 | 0.481398 | 119.059 |
| 3 | 09970067 | 0.480286 | 0.00111198 | 108.158 | 09970069 | 0.0218412 | 0.459557 | 109.350 |