| Red | Green | Blue | |
| z | 17.64 | ||
| znorm | Inf | ||
| sky | -Inf | -Inf | -Inf |
| S/N | 23.4 | 39.6 | 41.6 |
| S/N(c) | 0.0 | 0.0 | 0.0 |
| SN(E/C) |

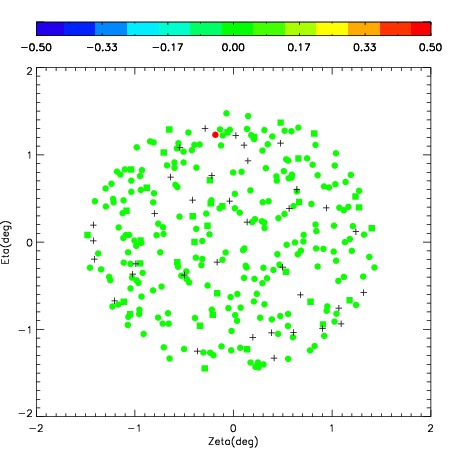
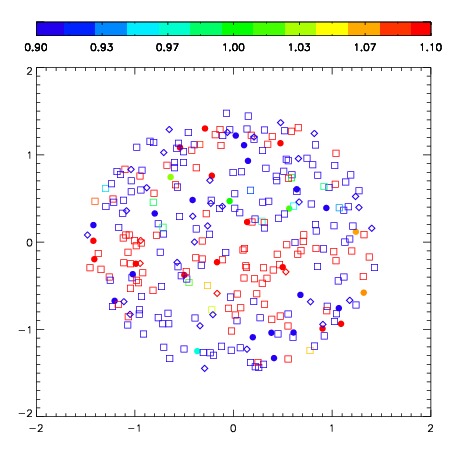

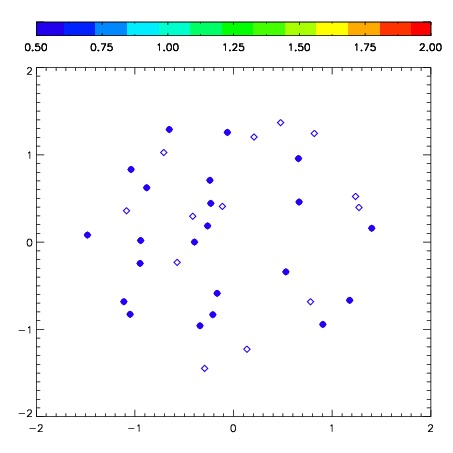
| Frame | Nreads | Zeropoints | Mag plots | Spatial mag deviation | Spatial sky 16325A emission deviations (filled: sky, open: star) | Spatial sky continuum emission | Spatial sky telluric CO2 absorption deviations (filled: H < 10) | |||||||||||||||||||||||
| 0 | 0 |
|
|
|
|
|
|
| IPAIR | NAME | SHIFT | NEWSHIFT | S/N | NAME | SHIFT | NEWSHIFT | S/N |
| 0 | 03700010 | 0.342580 | 0.00000 | 268.801 | 03700011 | -0.0170771 | 0.359657 | 259.156 |
| 1 | 03700013 | 0.339711 | 0.00286898 | 285.345 | 03700015 | -0.0142123 | 0.356792 | 293.234 |
| 2 | 03700014 | 0.331809 | 0.0107710 | 284.690 | 03700012 | -0.0166602 | 0.359240 | 278.402 |
| 3 | 03700009 | 0.336165 | 0.00641498 | 271.271 | 03700008 | 0.00000 | 0.342580 | 267.204 |