| Red | Green | Blue | |
| z | 17.64 | ||
| znorm | Inf | ||
| sky | -Inf | -NaN | -Inf |
| S/N | 26.4 | 42.8 | 45.7 |
| S/N(c) | 0.0 | 0.0 | 0.0 |
| SN(E/C) |

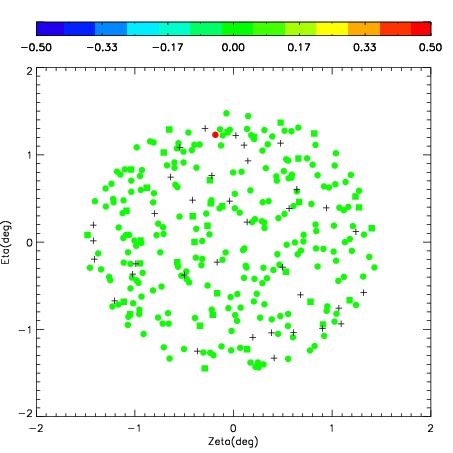
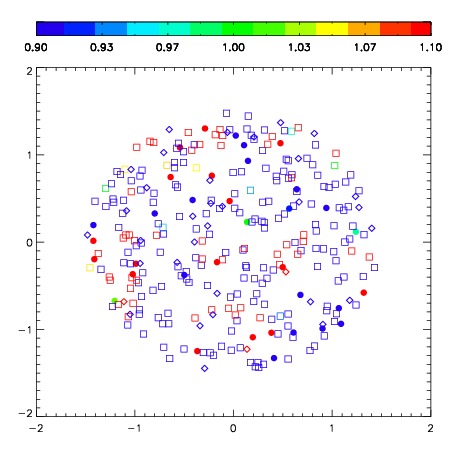
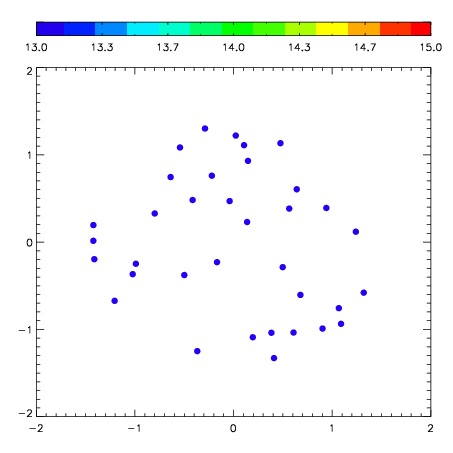
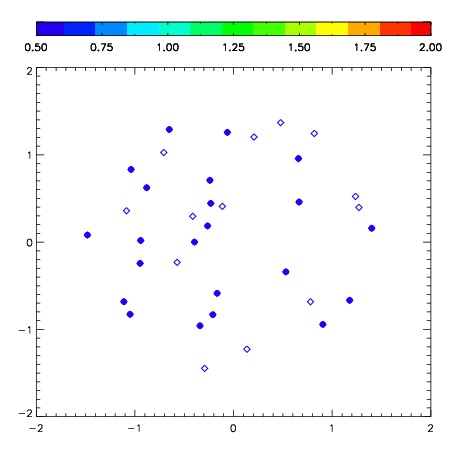
| Frame | Nreads | Zeropoints | Mag plots | Spatial mag deviation | Spatial sky 16325A emission deviations (filled: sky, open: star) | Spatial sky continuum emission | Spatial sky telluric CO2 absorption deviations (filled: H < 10) | |||||||||||||||||||||||
| 0 | 0 |
|
|
|
|
|
|
| IPAIR | NAME | SHIFT | NEWSHIFT | S/N | NAME | SHIFT | NEWSHIFT | S/N |
| 0 | 06730012 | 0.332984 | 0.00000 | 283.356 | 06730011 | 0.00000 | 0.332984 | 282.619 |
| 1 | 06730013 | 0.332080 | 0.000903994 | 287.820 | 06730015 | -0.0119344 | 0.344918 | 284.209 |
| 2 | 06730017 | 0.325945 | 0.00703901 | 280.955 | 06730018 | -0.0147125 | 0.347697 | 282.587 |
| 3 | 06730016 | 0.331738 | 0.00124601 | 278.712 | 06730014 | -0.0131759 | 0.346160 | 279.771 |