| Red | Green | Blue | |
| z | 17.64 | ||
| znorm | Inf | ||
| sky | -Inf | -Inf | -Inf |
| S/N | 24.9 | 40.1 | 41.2 |
| S/N(c) | 0.0 | 0.0 | 0.0 |
| SN(E/C) |

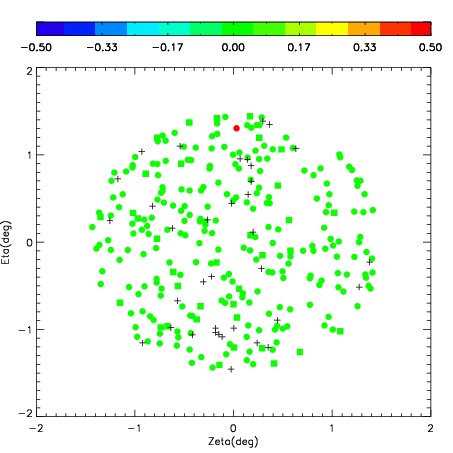
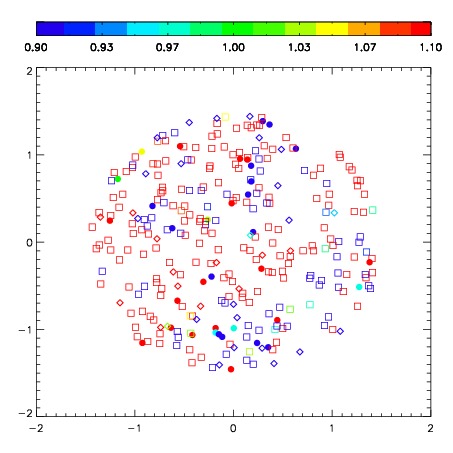

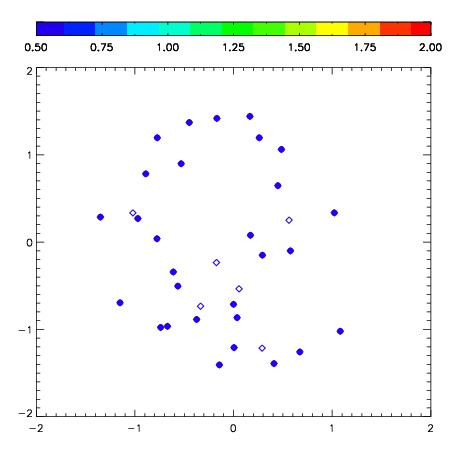
| Frame | Nreads | Zeropoints | Mag plots | Spatial mag deviation | Spatial sky 16325A emission deviations (filled: sky, open: star) | Spatial sky continuum emission | Spatial sky telluric CO2 absorption deviations (filled: H < 10) | |||||||||||||||||||||||
| 0 | 0 |
|
|
|
|
|
|
| IPAIR | NAME | SHIFT | NEWSHIFT | S/N | NAME | SHIFT | NEWSHIFT | S/N |
| 0 | 03640016 | 0.313550 | 0.00000 | 67.1050 | 03640010 | 0.00000 | 0.313550 | 68.1952 |
| 1 | 03640011 | 0.309273 | 0.00427699 | 74.2370 | 03640014 | -0.0608439 | 0.374394 | 72.9844 |
| 2 | 03640012 | 0.304456 | 0.00909400 | 72.4413 | 03640013 | -0.0662224 | 0.379772 | 70.3748 |
| 3 | 03640015 | 0.308515 | 0.00503498 | 67.0220 | 03640017 | -0.0545037 | 0.368054 | 63.1824 |