| Red | Green | Blue | |
| z | 17.64 | ||
| znorm | Inf | ||
| sky | -NaN | -NaN | -Inf |
| S/N | 23.5 | 39.3 | 39.9 |
| S/N(c) | 0.0 | 0.0 | 0.0 |
| SN(E/C) |


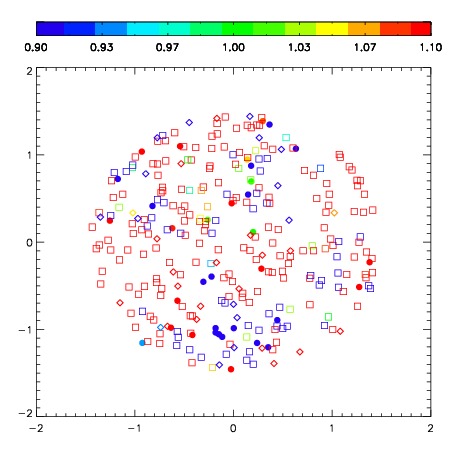


| Frame | Nreads | Zeropoints | Mag plots | Spatial mag deviation | Spatial sky 16325A emission deviations (filled: sky, open: star) | Spatial sky continuum emission | Spatial sky telluric CO2 absorption deviations (filled: H < 10) | |||||||||||||||||||||||
| 0 | 0 |
|
|
|
|
|
|
| IPAIR | NAME | SHIFT | NEWSHIFT | S/N | NAME | SHIFT | NEWSHIFT | S/N |
| 0 | 03680013 | 0.474776 | 0.00000 | 51.7194 | 03680015 | 0.0165121 | 0.458264 | 50.4336 |
| 1 | 03680009 | 0.468880 | 0.00589600 | 51.9523 | 03680012 | 0.0140742 | 0.460702 | 53.1816 |
| 2 | 03680014 | 0.465946 | 0.00883001 | 47.2243 | 03680008 | 0.00000 | 0.474776 | 46.5296 |
| 3 | 03680010 | 0.470515 | 0.00426099 | 45.8294 | 03680011 | 0.0113396 | 0.463436 | 43.4466 |