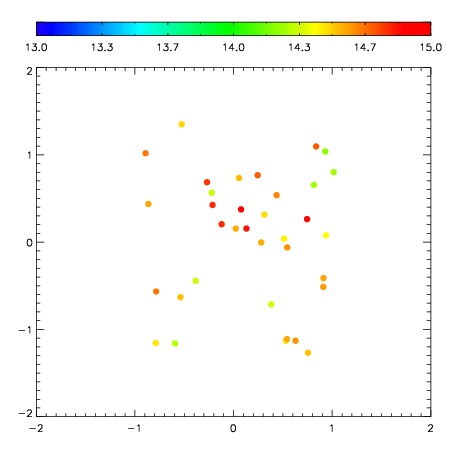
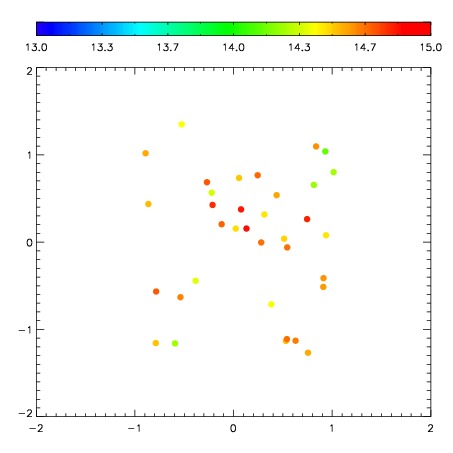
| Frame | Nreads | Zeropoints | Mag plots
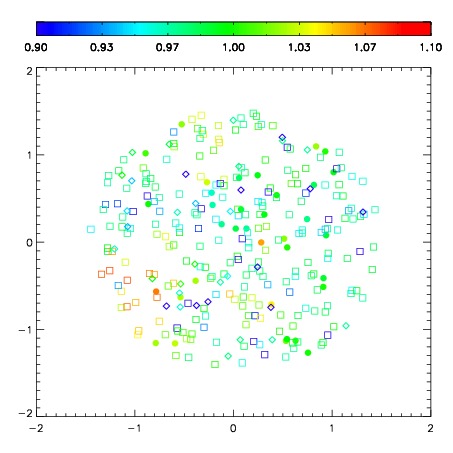
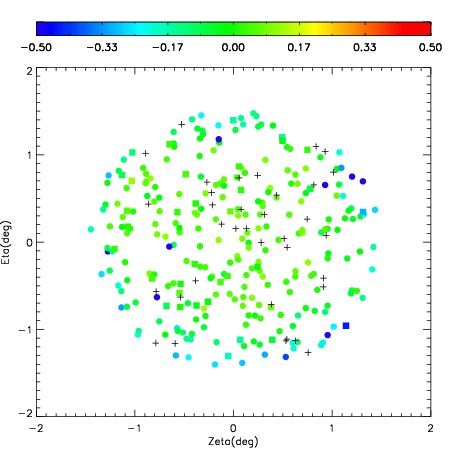
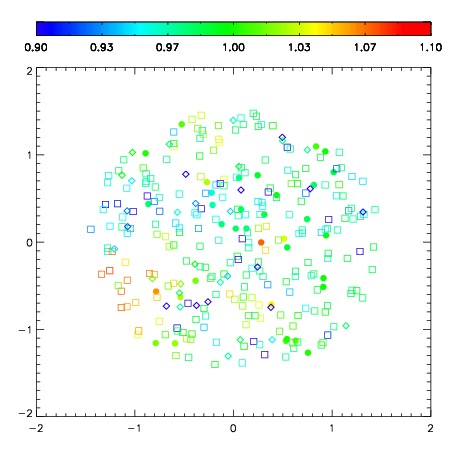
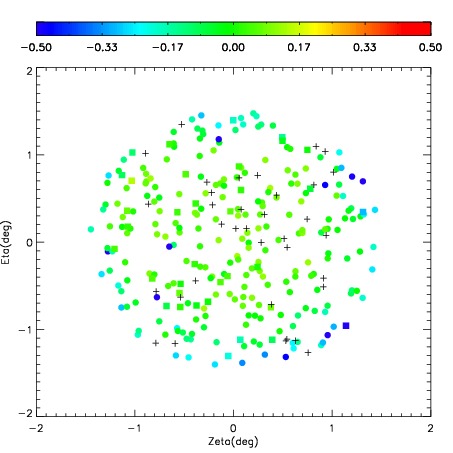
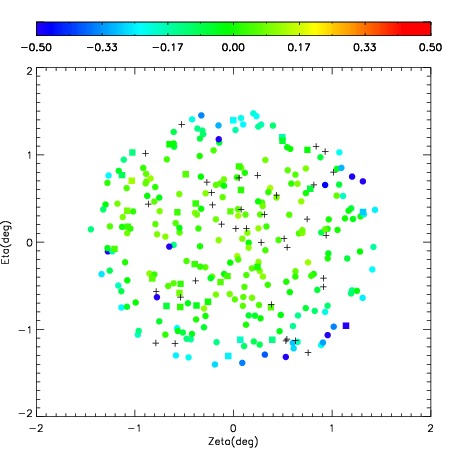
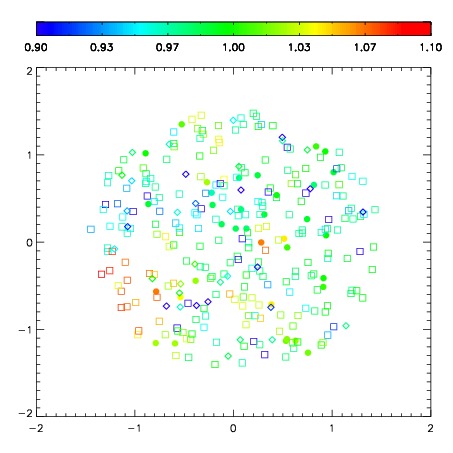
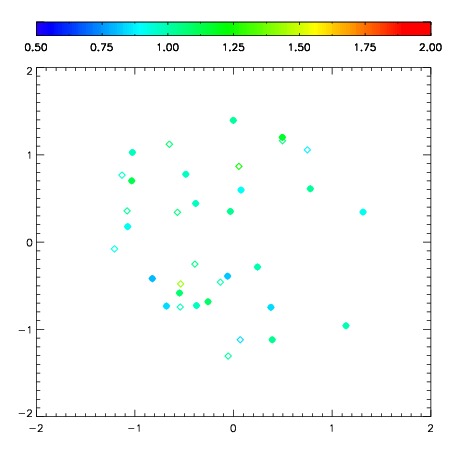
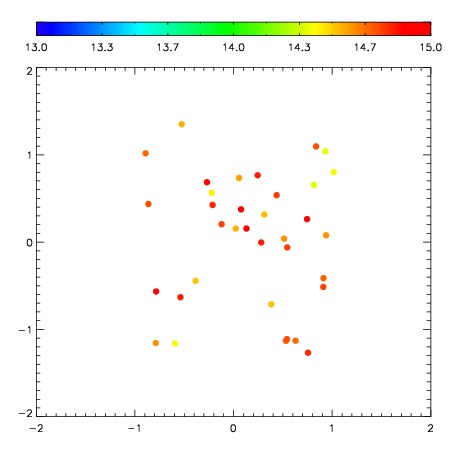
| Spatial mag deviation
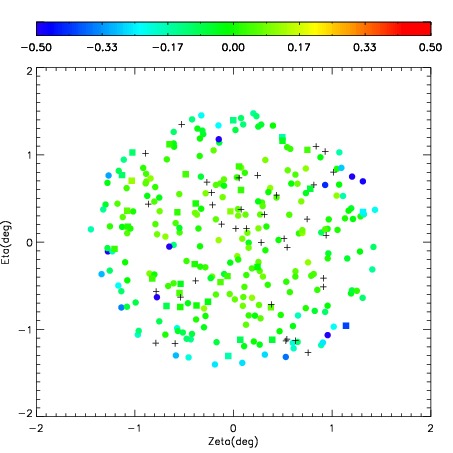
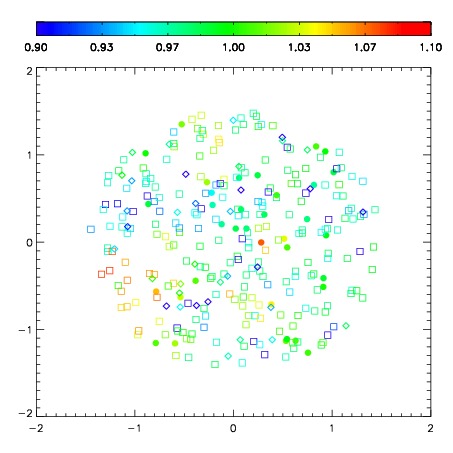
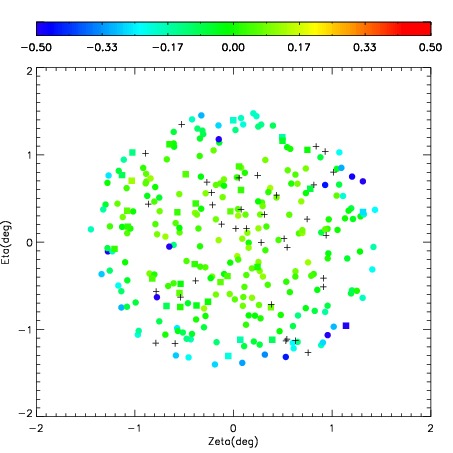
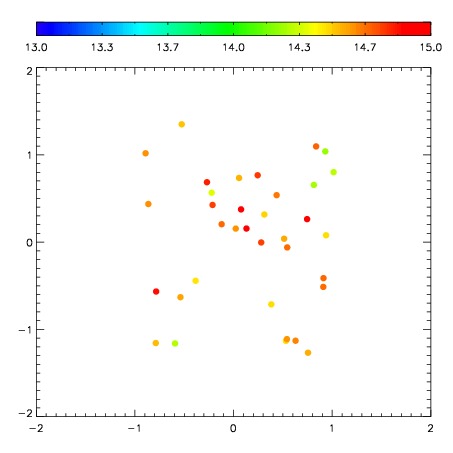
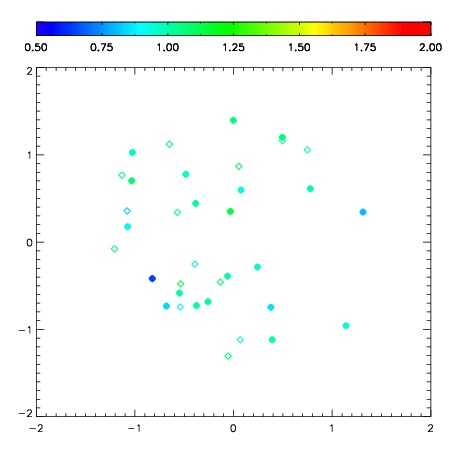
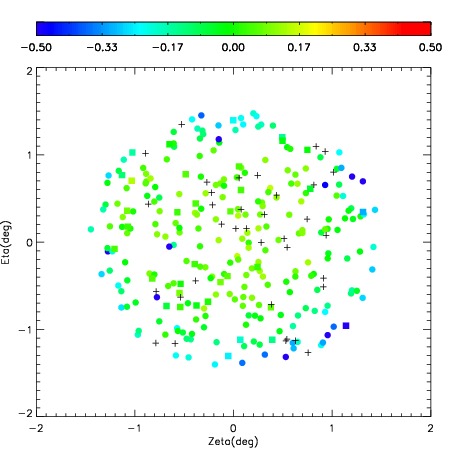
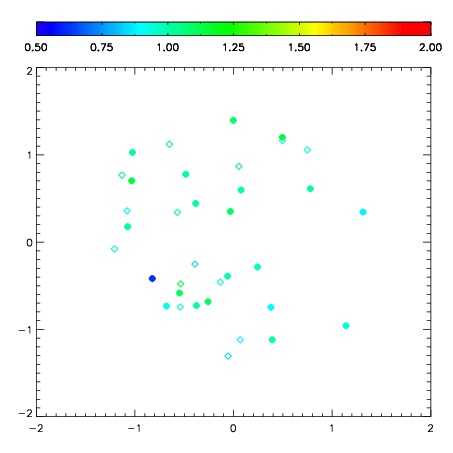
| Spatial sky 16325A emission deviations (filled: sky, open: star)
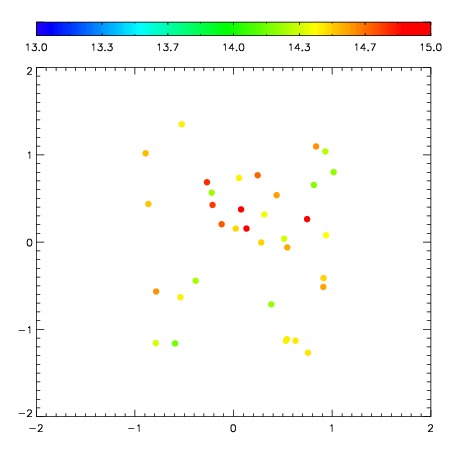
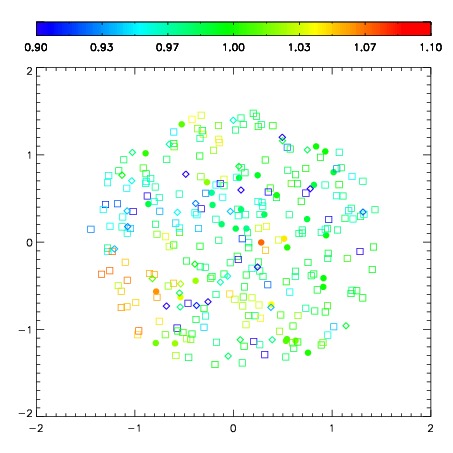
| Spatial sky continuum emission
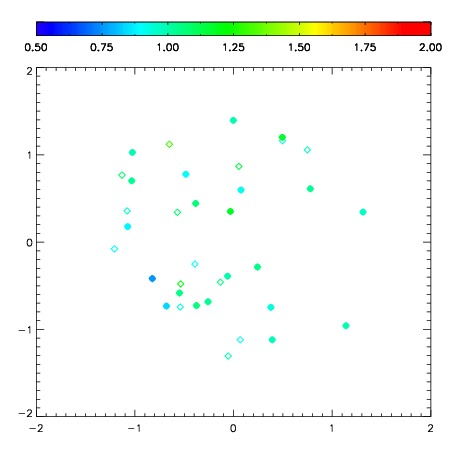
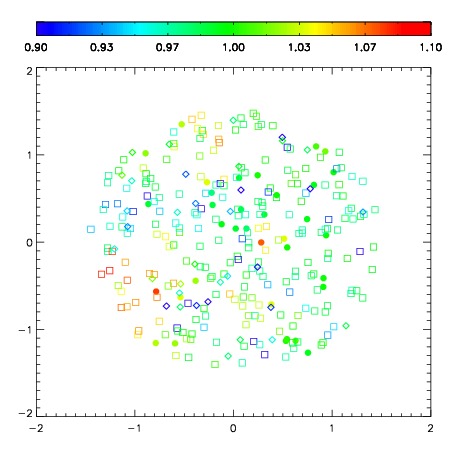
| Spatial sky telluric CO2 absorption deviations (filled: H < 10)
|
| 10200070
| 47
| | Red | Green | Blue
| | z | | 19.19
| | znorm | | 15.01
| | sky | 15.1 | 14.5 | 14.5
| | S/N | 16.6 | 26.0 | 28.4
| | S/N(c) | 14.7 | 24.4 | 27.1
| | SN(E/C) 0.96
|
| 
| 
| 
| 
| 
|
| 10200071
| 47
| | Red | Green | Blue
| | z | | 19.21
| | znorm | | 15.03
| | sky | 14.8 | 14.5 | 14.8
| | S/N | 16.7 | 26.5 | 29.1
| | S/N(c) | 14.9 | 24.8 | 27.5
| | SN(E/C) 0.92
|
| 
| 
| 
| 
| 
|
| 10200072
| 47
| | Red | Green | Blue
| | z | | 19.21
| | znorm | | 15.03
| | sky | 14.9 | 14.6 | 14.8
| | S/N | 16.6 | 26.7 | 29.3
| | S/N(c) | 14.8 | 24.4 | 27.5
| | SN(E/C) 0.93
|
| 
| 
| 
| 
| 
|
| 10200073
| 47
| | Red | Green | Blue
| | z | | 19.14
| | znorm | | 14.96
| | sky | 14.8 | 14.6 | 14.9
| | S/N | 15.9 | 25.5 | 27.7
| | S/N(c) | 14.1 | 23.5 | 26.3
| | SN(E/C) 0.94
|
| 
| 
| 
| 
| 
|
| 10200074
| 47
| | Red | Green | Blue
| | z | | 19.18
| | znorm | | 15.00
| | sky | 14.9 | 14.6 | 14.8
| | S/N | 16.3 | 26.2 | 28.3
| | S/N(c) | 14.3 | 24.4 | 26.9
| | SN(E/C) 0.94
|
| 
| 
| 
| 
| 
|
| 10200075
| 47
| | Red | Green | Blue
| | z | | 19.14
| | znorm | | 14.96
| | sky | 14.8 | 14.6 | 15.0
| | S/N | 16.0 | 25.4 | 27.7
| | S/N(c) | 14.1 | 23.6 | 26.0
| | SN(E/C) 0.98
|
| 
| 
| 
| 
| 
|
| 10200076
| 47
| | Red | Green | Blue
| | z | | 19.05
| | znorm | | 14.87
| | sky | 14.6 | 14.8 | 14.9
| | S/N | 14.9 | 24.2 | 26.2
| | S/N(c) | 13.3 | 22.4 | 25.0
| | SN(E/C) 0.96
|
| 
| 
| 
| 
| 
|
| 10200077
| 47
| | Red | Green | Blue
| | z | | 19.10
| | znorm | | 14.92
| | sky | 14.7 | 14.7 | 14.9
| | S/N | 15.5 | 24.8 | 26.8
| | S/N(c) | 13.6 | 22.9 | 25.4
| | SN(E/C) 0.93
|
| 
| 
| 
| 
| 
|