| Red | Green | Blue | |
| z | 17.64 | ||
| znorm | Inf | ||
| sky | -NaN | -Inf | -Inf |
| S/N | 23.6 | 38.5 | 41.8 |
| S/N(c) | 0.0 | 0.0 | 0.0 |
| SN(E/C) |


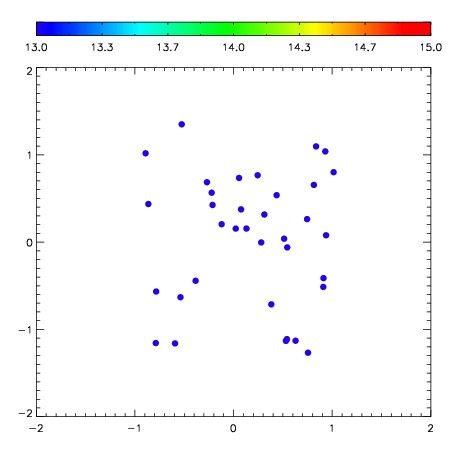
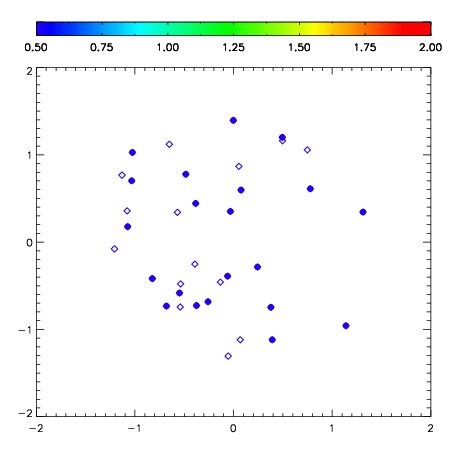
| Frame | Nreads | Zeropoints | Mag plots | Spatial mag deviation | Spatial sky 16325A emission deviations (filled: sky, open: star) | Spatial sky continuum emission | Spatial sky telluric CO2 absorption deviations (filled: H < 10) | |||||||||||||||||||||||
| 0 | 0 |
|
|
|
|
|
|
| IPAIR | NAME | SHIFT | NEWSHIFT | S/N | NAME | SHIFT | NEWSHIFT | S/N |
| 0 | 10200075 | 0.269535 | 0.00000 | 268.125 | 10200073 | -0.0380352 | 0.307570 | 268.394 |
| 1 | 10200072 | 0.263510 | 0.00602502 | 278.419 | 10200074 | -0.0310979 | 0.300633 | 273.760 |
| 2 | 10200071 | 0.257442 | 0.0120930 | 274.532 | 10200070 | 0.00000 | 0.269535 | 273.371 |
| 3 | 10200076 | 0.268719 | 0.000816017 | 258.794 | 10200077 | -0.0394519 | 0.308987 | 264.677 |