| Red | Green | Blue | |
| z | 17.64 | ||
| znorm | Inf | ||
| sky | -Inf | -Inf | -Inf |
| S/N | 26.5 | 45.8 | 48.4 |
| S/N(c) | 0.0 | 0.0 | 0.0 |
| SN(E/C) |

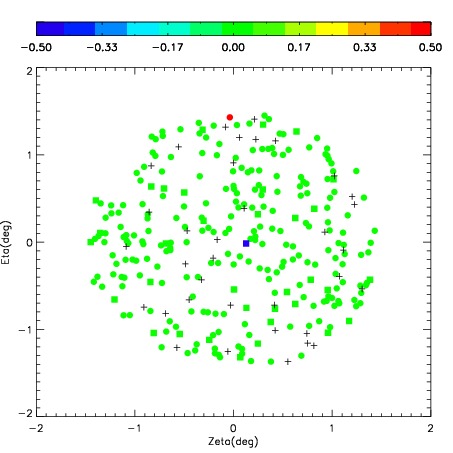
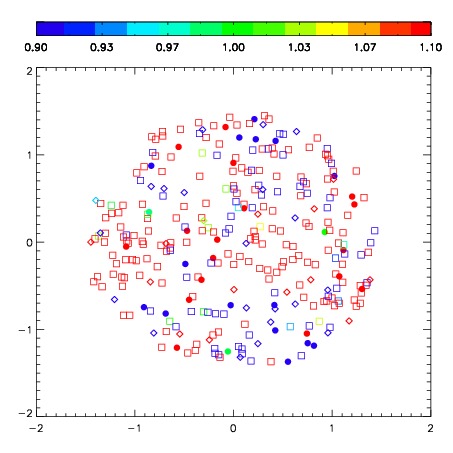


| Frame | Nreads | Zeropoints | Mag plots | Spatial mag deviation | Spatial sky 16325A emission deviations (filled: sky, open: star) | Spatial sky continuum emission | Spatial sky telluric CO2 absorption deviations (filled: H < 10) | |||||||||||||||||||||||
| 0 | 0 |
|
|
|
|
|
|
| IPAIR | NAME | SHIFT | NEWSHIFT | S/N | NAME | SHIFT | NEWSHIFT | S/N |
| 0 | 03660009 | 0.441756 | 0.00000 | 243.133 | 03660011 | 0.00283557 | 0.438920 | 243.881 |
| 1 | 03660010 | 0.439425 | 0.00233102 | 248.661 | 03660015 | 0.00186047 | 0.439896 | 246.212 |
| 2 | 03660013 | 0.428897 | 0.0128590 | 243.055 | 03660008 | 0.00000 | 0.441756 | 242.504 |
| 3 | 03660014 | 0.435465 | 0.00629100 | 239.713 | 03660012 | -0.00279716 | 0.444553 | 239.441 |