| Red | Green | Blue | |
| z | 17.64 | ||
| znorm | Inf | ||
| sky | -Inf | -NaN | -Inf |
| S/N | 25.1 | 41.7 | 44.7 |
| S/N(c) | 0.0 | 0.0 | 0.0 |
| SN(E/C) |

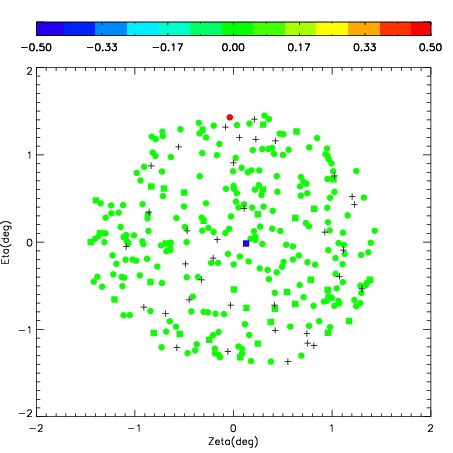
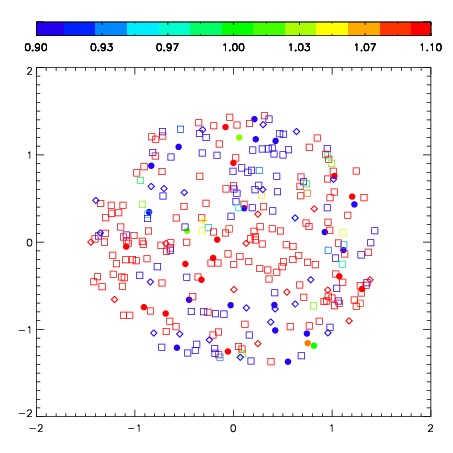


| Frame | Nreads | Zeropoints | Mag plots | Spatial mag deviation | Spatial sky 16325A emission deviations (filled: sky, open: star) | Spatial sky continuum emission | Spatial sky telluric CO2 absorption deviations (filled: H < 10) | |||||||||||||||||||||||
| 0 | 0 |
|
|
|
|
|
|
| IPAIR | NAME | SHIFT | NEWSHIFT | S/N | NAME | SHIFT | NEWSHIFT | S/N |
| 0 | 07520017 | 0.371786 | 0.00000 | 251.767 | 07520018 | -0.0100954 | 0.381881 | 255.843 |
| 1 | 07520012 | 0.359410 | 0.0123760 | 248.852 | 07520011 | 0.00000 | 0.371786 | 252.194 |
| 2 | 07520013 | 0.359800 | 0.0119860 | 248.710 | 07520014 | -0.0114619 | 0.383248 | 248.166 |
| 3 | 07520016 | 0.368425 | 0.00336099 | 247.531 | 07520015 | -0.0131004 | 0.384886 | 244.819 |