| Red | Green | Blue | |
| z | 17.64 | ||
| znorm | Inf | ||
| sky | -Inf | -Inf | -Inf |
| S/N | 27.8 | 47.1 | 49.9 |
| S/N(c) | 0.0 | 0.0 | 0.0 |
| SN(E/C) |
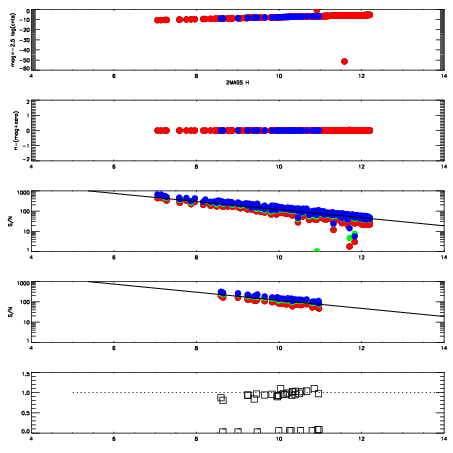
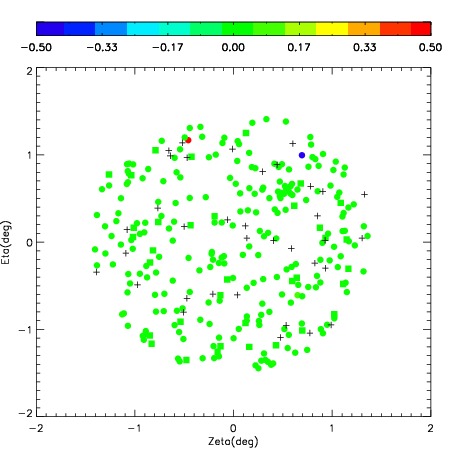
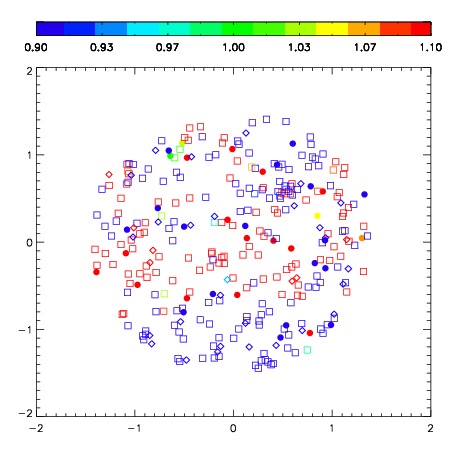


| Frame | Nreads | Zeropoints | Mag plots | Spatial mag deviation | Spatial sky 16325A emission deviations (filled: sky, open: star) | Spatial sky continuum emission | Spatial sky telluric CO2 absorption deviations (filled: H < 10) | |||||||||||||||||||||||
| 0 | 0 |
|
|
|
|
|
|
| IPAIR | NAME | SHIFT | NEWSHIFT | S/N | NAME | SHIFT | NEWSHIFT | S/N |
| 0 | 03660026 | 0.425363 | 0.00000 | 308.007 | 03660031 | -0.0197156 | 0.445079 | 310.639 |
| 1 | 03660030 | 0.410465 | 0.0148980 | 318.052 | 03660028 | -0.0196932 | 0.445056 | 317.273 |
| 2 | 03660029 | 0.409288 | 0.0160750 | 317.014 | 03660027 | -0.0197325 | 0.445096 | 311.754 |
| 3 | 03660025 | 0.423264 | 0.00209901 | 297.896 | 03660024 | 0.00000 | 0.425363 | 304.360 |