| Red | Green | Blue | |
| z | 17.64 | ||
| znorm | Inf | ||
| sky | -Inf | -NaN | -Inf |
| S/N | 29.9 | 48.8 | 51.5 |
| S/N(c) | 0.0 | 0.0 | 0.0 |
| SN(E/C) |


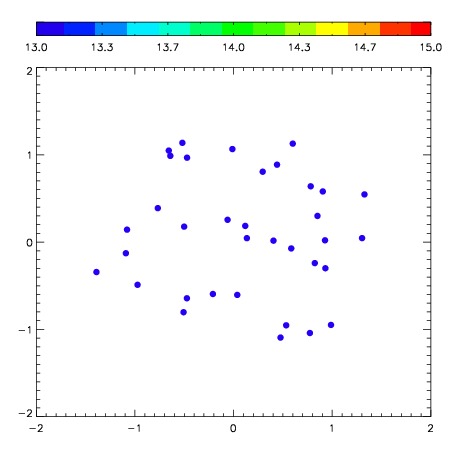
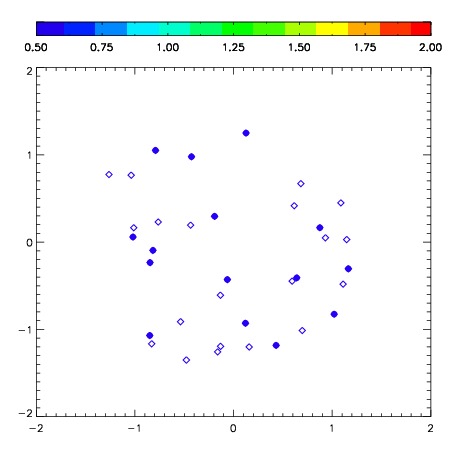
| Frame | Nreads | Zeropoints | Mag plots | Spatial mag deviation | Spatial sky 16325A emission deviations (filled: sky, open: star) | Spatial sky continuum emission | Spatial sky telluric CO2 absorption deviations (filled: H < 10) | |||||||||||||||||||||||
| 0 | 0 |
|
|
|
|
|
|
| IPAIR | NAME | SHIFT | NEWSHIFT | S/N | NAME | SHIFT | NEWSHIFT | S/N |
| 0 | 03950013 | 0.420044 | 0.00000 | 309.014 | 03950016 | -0.0202031 | 0.440247 | 307.251 |
| 1 | 03950018 | 0.404204 | 0.0158400 | 317.776 | 03950019 | -0.0232226 | 0.443267 | 319.405 |
| 2 | 03950017 | 0.406864 | 0.0131800 | 316.851 | 03950015 | -0.0180532 | 0.438097 | 310.440 |
| 3 | 03950014 | 0.415695 | 0.00434899 | 315.908 | 03950012 | 0.00000 | 0.420044 | 308.861 |