| Red | Green | Blue | |
| z | 17.64 | ||
| znorm | Inf | ||
| sky | -NaN | -NaN | -Inf |
| S/N | 26.9 | 45.1 | 47.7 |
| S/N(c) | 0.0 | 0.0 | 0.0 |
| SN(E/C) |

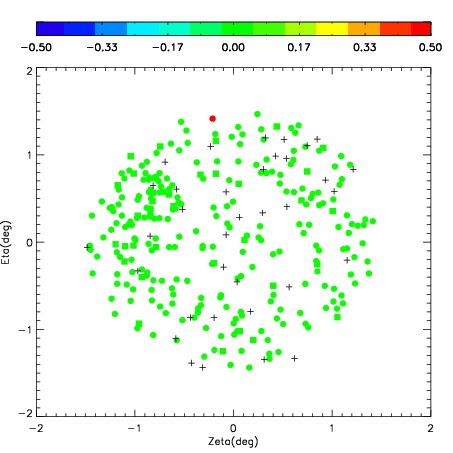
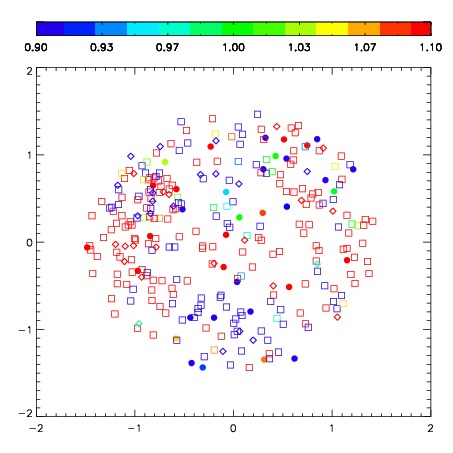
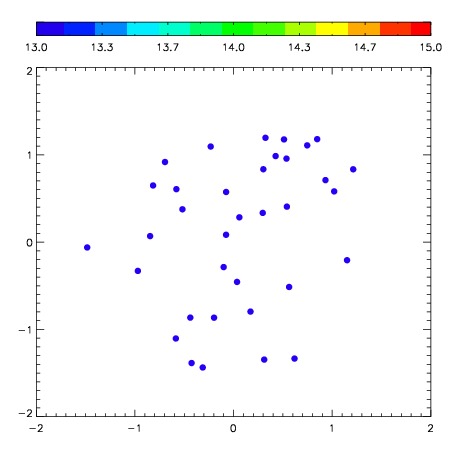
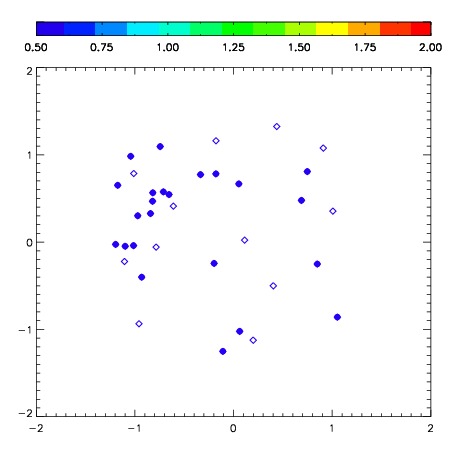
| Frame | Nreads | Zeropoints | Mag plots | Spatial mag deviation | Spatial sky 16325A emission deviations (filled: sky, open: star) | Spatial sky continuum emission | Spatial sky telluric CO2 absorption deviations (filled: H < 10) | |||||||||||||||||||||||
| 0 | 0 |
|
|
|
|
|
|
| IPAIR | NAME | SHIFT | NEWSHIFT | S/N | NAME | SHIFT | NEWSHIFT | S/N |
| 0 | 04040016 | 0.374557 | 0.00000 | 297.945 | 04040017 | -0.0119825 | 0.386539 | 301.897 |
| 1 | 04040011 | 0.366771 | 0.00778598 | 325.652 | 04040010 | 0.00000 | 0.374557 | 320.190 |
| 2 | 04040012 | 0.373271 | 0.00128600 | 323.021 | 04040013 | -0.0106791 | 0.385236 | 313.744 |
| 3 | 04040015 | 0.373339 | 0.00121799 | 306.375 | 04040014 | -0.0128798 | 0.387437 | 305.010 |