| Red | Green | Blue | |
| z | 17.64 | ||
| znorm | Inf | ||
| sky | -NaN | -Inf | -Inf |
| S/N | 21.6 | 36.8 | 39.4 |
| S/N(c) | 0.0 | 0.0 | 0.0 |
| SN(E/C) |

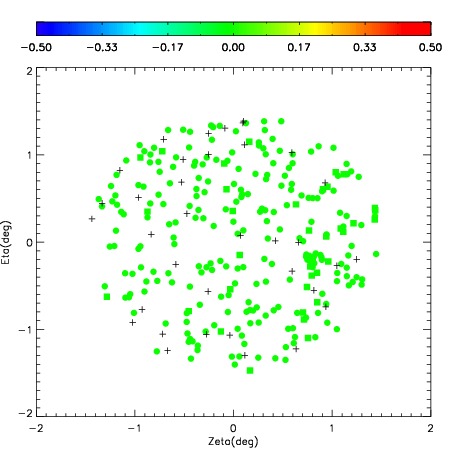
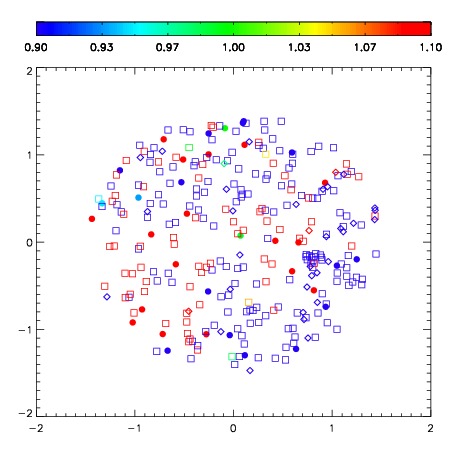
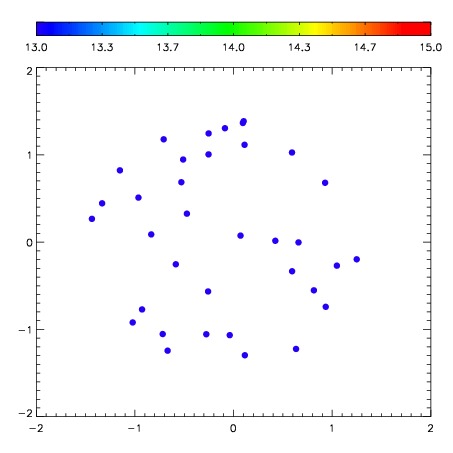

| Frame | Nreads | Zeropoints | Mag plots | Spatial mag deviation | Spatial sky 16325A emission deviations (filled: sky, open: star) | Spatial sky continuum emission | Spatial sky telluric CO2 absorption deviations (filled: H < 10) | |||||||||||||||||||||||
| 0 | 0 |
|
|
|
|
|
|
| IPAIR | NAME | SHIFT | NEWSHIFT | S/N | NAME | SHIFT | NEWSHIFT | S/N |
| 0 | 09990066 | 0.473320 | 0.00000 | 225.133 | 09990068 | 0.00165139 | 0.471669 | 136.183 |
| 1 | 09990070 | 0.471844 | 0.00147602 | 277.935 | 09990071 | 0.00252628 | 0.470794 | 275.019 |
| 2 | 09990069 | 0.472476 | 0.000844002 | 228.346 | 09990067 | 0.000860997 | 0.472459 | 274.549 |