| Red | Green | Blue | |
| z | 17.64 | ||
| znorm | Inf | ||
| sky | -Inf | -NaN | -Inf |
| S/N | 31.1 | 52.5 | 59.4 |
| S/N(c) | 0.0 | 0.0 | 0.0 |
| SN(E/C) |

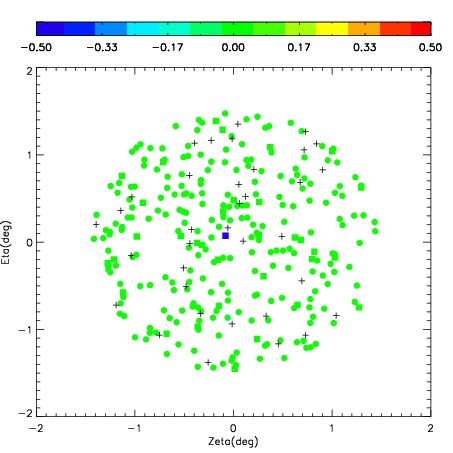
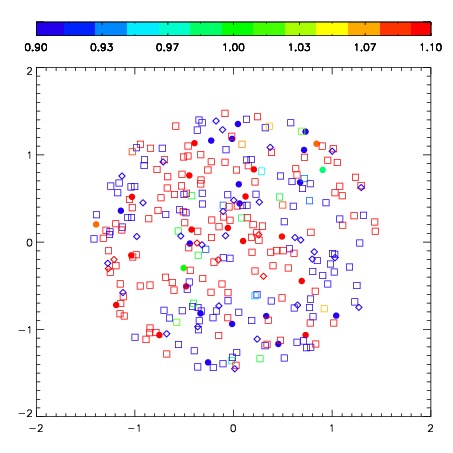


| Frame | Nreads | Zeropoints | Mag plots | Spatial mag deviation | Spatial sky 16325A emission deviations (filled: sky, open: star) | Spatial sky continuum emission | Spatial sky telluric CO2 absorption deviations (filled: H < 10) | |||||||||||||||||||||||
| 0 | 0 |
|
|
|
|
|
|
| IPAIR | NAME | SHIFT | NEWSHIFT | S/N | NAME | SHIFT | NEWSHIFT | S/N |
| 0 | 03670061 | 0.396396 | 0.00000 | 223.201 | 03670059 | 0.00000 | 0.396396 | 214.526 |
| 1 | 03670064 | 0.382617 | 0.0137790 | 232.170 | 03670066 | -0.0121201 | 0.408516 | 231.687 |
| 2 | 03670065 | 0.377789 | 0.0186070 | 230.962 | 03670062 | -0.0151228 | 0.411519 | 228.444 |
| 3 | 03670060 | 0.381971 | 0.0144250 | 224.050 | 03670063 | -0.0109609 | 0.407357 | 224.808 |