| Red | Green | Blue | |
| z | 17.64 | ||
| znorm | Inf | ||
| sky | -NaN | -Inf | -Inf |
| S/N | 21.5 | 38.4 | 40.4 |
| S/N(c) | 0.0 | 0.0 | 0.0 |
| SN(E/C) |
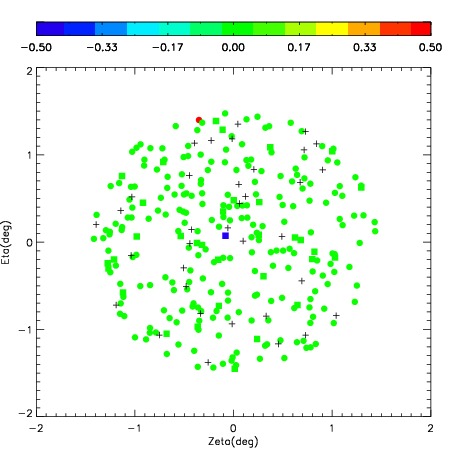

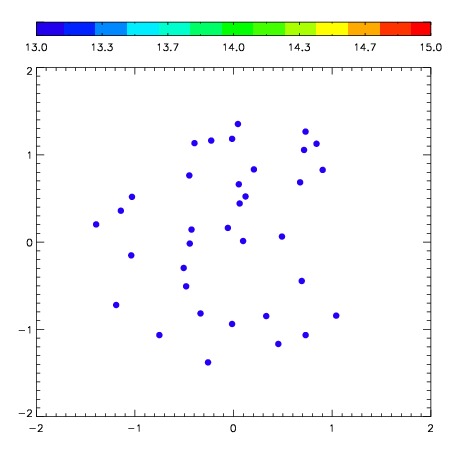
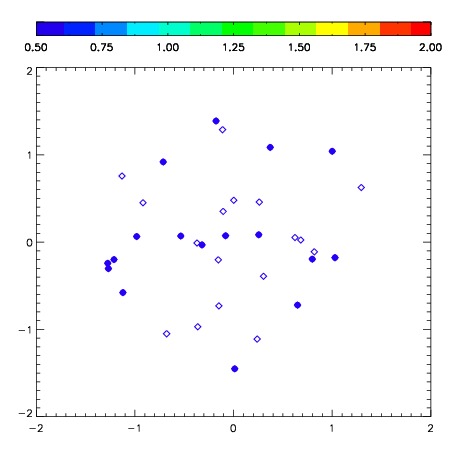
| Frame | Nreads | Zeropoints | Mag plots | Spatial mag deviation | Spatial sky 16325A emission deviations (filled: sky, open: star) | Spatial sky continuum emission | Spatial sky telluric CO2 absorption deviations (filled: H < 10) | |||||||||||||||||||||||
| 0 | 0 |
|
|
|
|
|
|
| IPAIR | NAME | SHIFT | NEWSHIFT | S/N | NAME | SHIFT | NEWSHIFT | S/N |
| 0 | 04010035 | 0.324796 | 0.00000 | 207.478 | 04010030 | 0.00000 | 0.324796 | 212.081 |
| 1 | 04010032 | 0.311711 | 0.0130850 | 219.300 | 04010033 | -0.0803254 | 0.405121 | 220.883 |
| 2 | 04010031 | 0.319123 | 0.00567299 | 216.466 | 04010034 | -0.0855063 | 0.410302 | 215.993 |
| 3 | 04010036 | 0.315743 | 0.00905299 | 191.500 | 04010037 | -0.0840955 | 0.408891 | 168.208 |