| Red | Green | Blue | |
| z | 17.64 | ||
| znorm | Inf | ||
| sky | -NaN | -NaN | -Inf |
| S/N | 28.4 | 46.9 | 51.5 |
| S/N(c) | 0.0 | 0.0 | 0.0 |
| SN(E/C) |

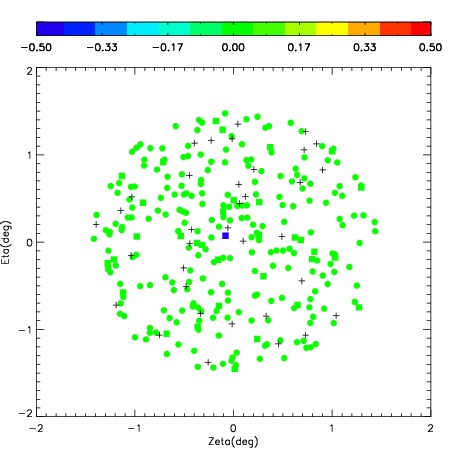
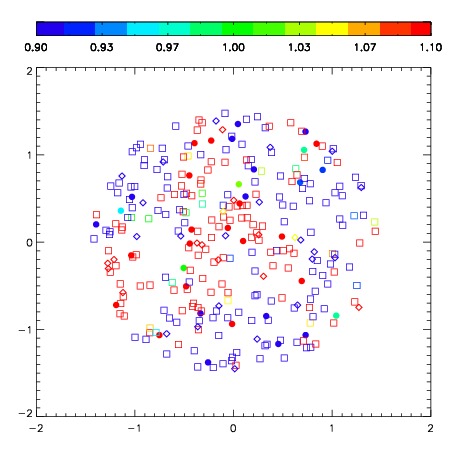
| Frame | Nreads | Zeropoints | Mag plots | Spatial mag deviation | Spatial sky 16325A emission deviations (filled: sky, open: star) | Spatial sky continuum emission | Spatial sky telluric CO2 absorption deviations (filled: H < 10) | |||||||||||||||||||||||
| 0 | 0 |
|
|
|
|
|
|
| IPAIR | NAME | SHIFT | NEWSHIFT | S/N | NAME | SHIFT | NEWSHIFT | S/N |
| 0 | 04060012 | 0.346754 | 0.00000 | 219.037 | 04060013 | -0.0604908 | 0.407245 | 216.522 |
| 1 | 04060016 | 0.342551 | 0.00420302 | 224.111 | 04060017 | -0.0600241 | 0.406778 | 224.605 |
| 2 | 04060015 | 0.340635 | 0.00611901 | 220.503 | 04060010 | 0.00000 | 0.346754 | 221.467 |
| 3 | 04060011 | 0.335238 | 0.0115160 | 219.756 | 04060014 | -0.0631137 | 0.409868 | 219.784 |