| Red | Green | Blue | |
| z | 17.64 | ||
| znorm | Inf | ||
| sky | -Inf | -Inf | -Inf |
| S/N | 24.7 | 42.2 | 51.4 |
| S/N(c) | 0.0 | 0.0 | 0.0 |
| SN(E/C) |
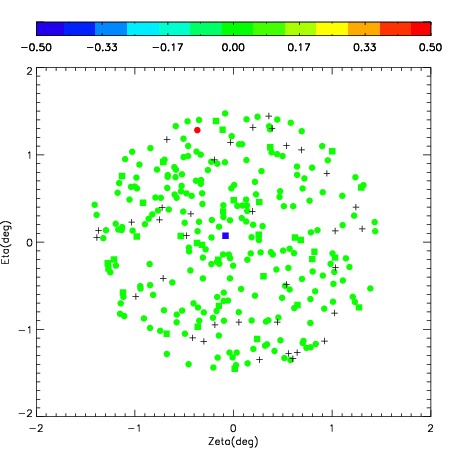
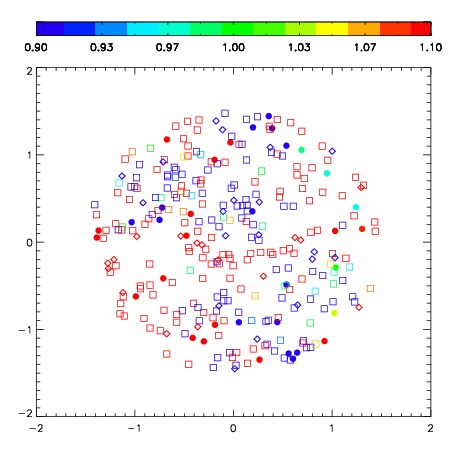
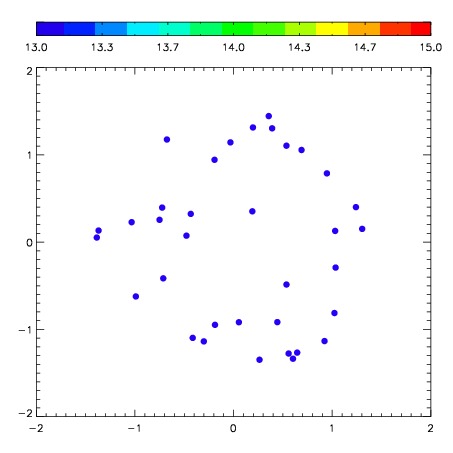
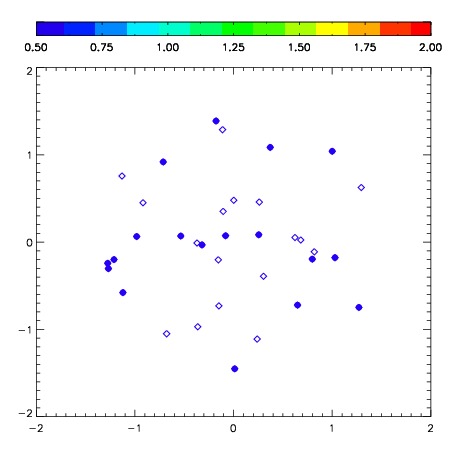
| Frame | Nreads | Zeropoints | Mag plots | Spatial mag deviation | Spatial sky 16325A emission deviations (filled: sky, open: star) | Spatial sky continuum emission | Spatial sky telluric CO2 absorption deviations (filled: H < 10) | |||||||||||||||||||||||
| 0 | 0 |
|
|
|
|
|
|
| IPAIR | NAME | SHIFT | NEWSHIFT | S/N | NAME | SHIFT | NEWSHIFT | S/N |
| 0 | 03680062 | 0.398119 | 0.00000 | 206.119 | 03680067 | -0.0295001 | 0.427619 | 174.264 |
| 1 | 03680066 | 0.394688 | 0.00343099 | 214.756 | 03680063 | -0.0255162 | 0.423635 | 215.636 |
| 2 | 03680065 | 0.392413 | 0.00570601 | 213.557 | 03680064 | -0.0239540 | 0.422073 | 209.322 |
| 3 | 03680061 | 0.395634 | 0.00248501 | 208.651 | 03680060 | 0.00000 | 0.398119 | 207.492 |