| Red | Green | Blue | |
| z | 17.64 | ||
| znorm | Inf | ||
| sky | -NaN | -NaN | -Inf |
| S/N | 23.7 | 42.4 | 45.1 |
| S/N(c) | 0.0 | 0.0 | 0.0 |
| SN(E/C) |

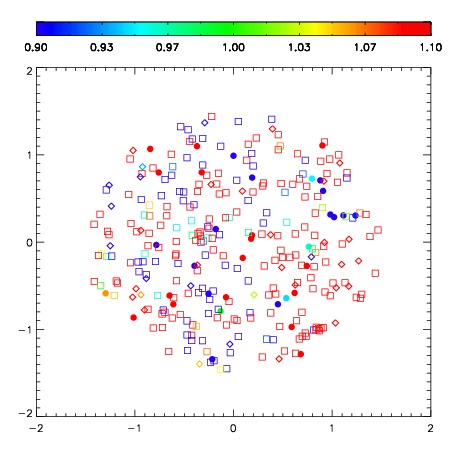
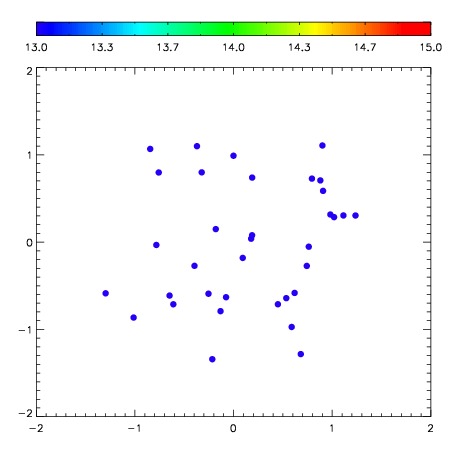
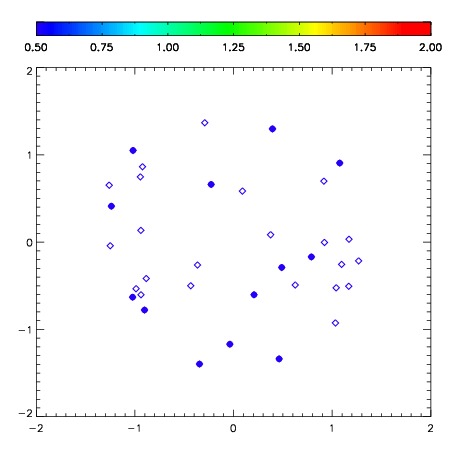
| Frame | Nreads | Zeropoints | Mag plots | Spatial mag deviation | Spatial sky 16325A emission deviations (filled: sky, open: star) | Spatial sky continuum emission | Spatial sky telluric CO2 absorption deviations (filled: H < 10) | |||||||||||||||||||||||
| 0 | 0 |
|
|
|
|
|
|
| IPAIR | NAME | SHIFT | NEWSHIFT | S/N | NAME | SHIFT | NEWSHIFT | S/N |
| 0 | 10490087 | 0.520371 | 0.00000 | 174.561 | 10490092 | 0.0365537 | 0.483817 | 178.015 |
| 1 | 10490095 | 0.507222 | 0.0131490 | 207.712 | 10490096 | 0.0379241 | 0.482447 | 214.839 |
| 2 | 10490091 | 0.511754 | 0.00861704 | 201.272 | 10490089 | 0.0356539 | 0.484717 | 197.587 |
| 3 | 10490090 | 0.512780 | 0.00759101 | 199.326 | 10490088 | 0.0353091 | 0.485062 | 185.907 |
| 4 | 10490094 | 0.516167 | 0.00420403 | 176.019 | 10490093 | 0.0374691 | 0.482902 | 178.780 |
| 5 | 10490083 | 0.516694 | 0.00367701 | 171.028 | 10490084 | 0.0361358 | 0.484235 | 172.609 |
| 6 | 10490086 | 0.517783 | 0.00258803 | 168.427 | 10490085 | 0.0389327 | 0.481438 | 172.008 |
| 7 | 10490082 | 0.518360 | 0.00201100 | 162.264 | 10490081 | 0.00000 | 0.520371 | 154.273 |