| Red | Green | Blue | |
| z | 17.64 | ||
| znorm | Inf | ||
| sky | -Inf | -Inf | -Inf |
| S/N | 21.6 | 37.1 | 40.7 |
| S/N(c) | 0.0 | 0.0 | 0.0 |
| SN(E/C) |

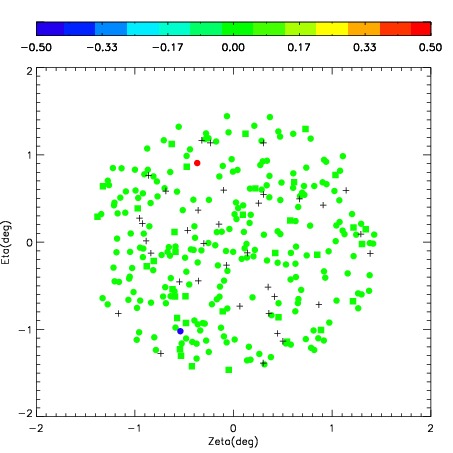
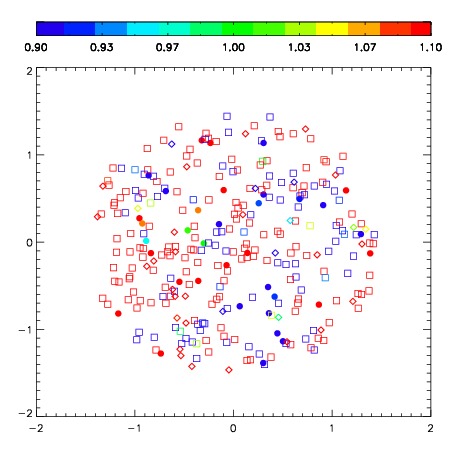

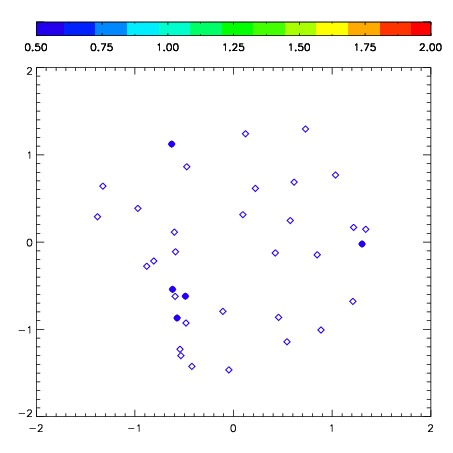
| Frame | Nreads | Zeropoints | Mag plots | Spatial mag deviation | Spatial sky 16325A emission deviations (filled: sky, open: star) | Spatial sky continuum emission | Spatial sky telluric CO2 absorption deviations (filled: H < 10) | |||||||||||||||||||||||
| 0 | 0 |
|
|
|
|
|
|
| IPAIR | NAME | SHIFT | NEWSHIFT | S/N | NAME | SHIFT | NEWSHIFT | S/N |
| 0 | 08140017 | 0.444944 | 0.00000 | 198.988 | 08140011 | 0.00000 | 0.444944 | 194.865 |
| 1 | 08140013 | 0.437612 | 0.00733200 | 213.272 | 08140015 | -0.00809254 | 0.453037 | 209.882 |
| 2 | 08140016 | 0.438391 | 0.00655299 | 206.403 | 08140014 | -0.00965499 | 0.454599 | 208.822 |
| 3 | 08140012 | 0.440031 | 0.00491300 | 204.881 | 08140018 | -0.00737034 | 0.452314 | 207.583 |