| Red | Green | Blue | |
| z | 17.64 | ||
| znorm | Inf | ||
| sky | -Inf | -Inf | -Inf |
| S/N | 25.0 | 43.7 | 46.7 |
| S/N(c) | 0.0 | 0.0 | 0.0 |
| SN(E/C) |
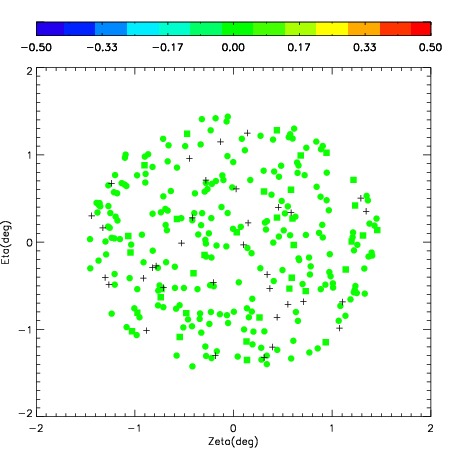
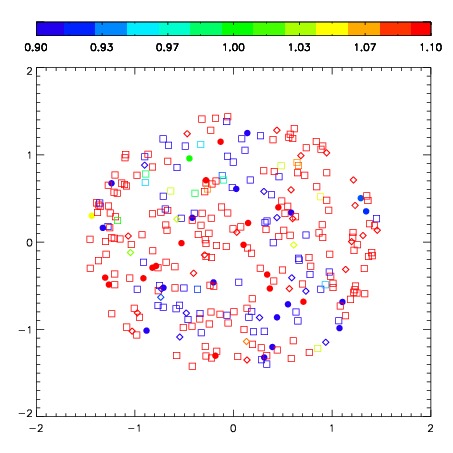
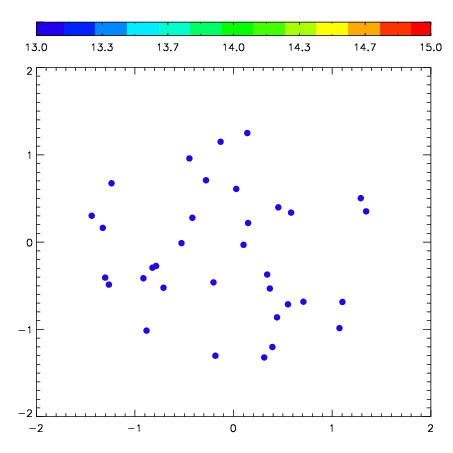
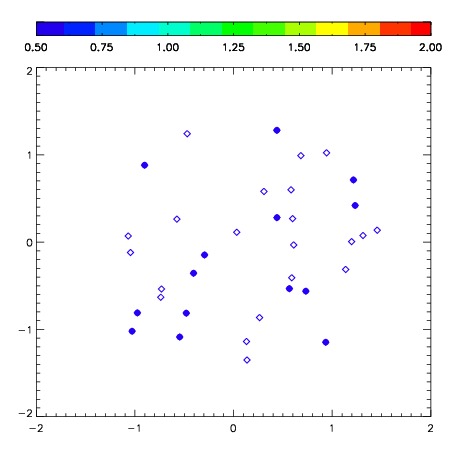
| Frame | Nreads | Zeropoints | Mag plots | Spatial mag deviation | Spatial sky 16325A emission deviations (filled: sky, open: star) | Spatial sky continuum emission | Spatial sky telluric CO2 absorption deviations (filled: H < 10) | |||||||||||||||||||||||
| 0 | 0 |
|
|
|
|
|
|
| IPAIR | NAME | SHIFT | NEWSHIFT | S/N | NAME | SHIFT | NEWSHIFT | S/N |
| 0 | 06670093 | 0.424266 | 0.00000 | 149.758 | 06670095 | -0.0227212 | 0.446987 | 150.520 |
| 1 | 06670101 | 0.421871 | 0.00239500 | 172.623 | 06670100 | -0.0221765 | 0.446443 | 173.594 |
| 2 | 06670098 | 0.423744 | 0.000522017 | 170.221 | 06670099 | -0.0198257 | 0.444092 | 168.211 |
| 3 | 06670097 | 0.418335 | 0.00593102 | 165.710 | 06670096 | -0.0245289 | 0.448795 | 155.469 |
| 4 | 06670094 | 0.420725 | 0.00354102 | 149.558 | 06670092 | 0.00000 | 0.424266 | 140.940 |