| Red | Green | Blue | |
| z | 17.64 | ||
| znorm | Inf | ||
| sky | -Inf | -Inf | -Inf |
| S/N | 22.1 | 38.3 | 46.1 |
| S/N(c) | 0.0 | 0.0 | 0.0 |
| SN(E/C) |
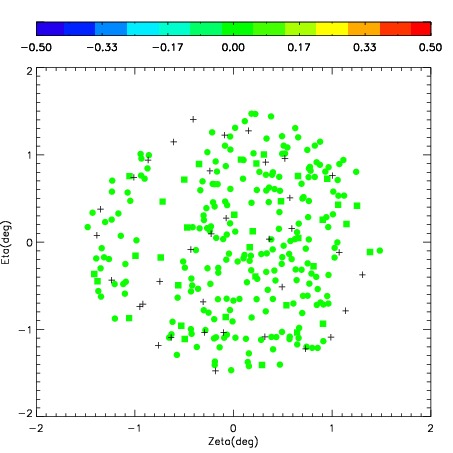
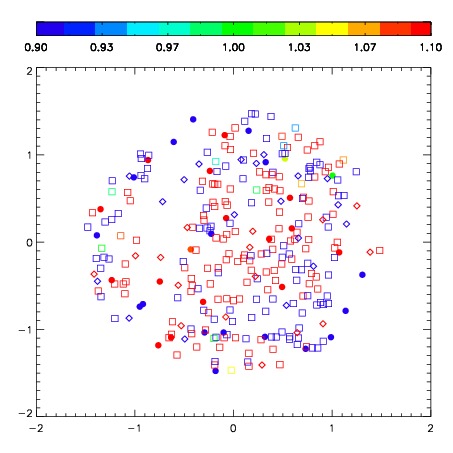
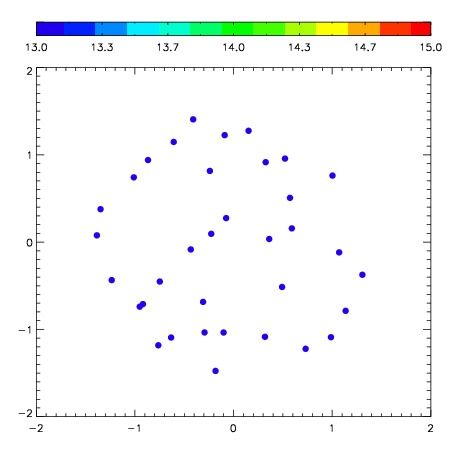
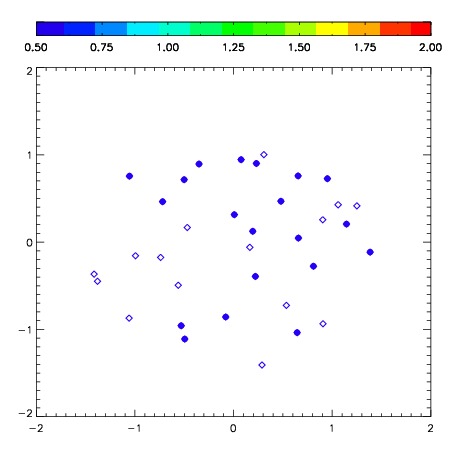
| Frame | Nreads | Zeropoints | Mag plots | Spatial mag deviation | Spatial sky 16325A emission deviations (filled: sky, open: star) | Spatial sky continuum emission | Spatial sky telluric CO2 absorption deviations (filled: H < 10) | |||||||||||||||||||||||
| 0 | 0 |
|
|
|
|
|
|
| IPAIR | NAME | SHIFT | NEWSHIFT | S/N | NAME | SHIFT | NEWSHIFT | S/N |
| 0 | 03690073 | 0.404738 | 0.00000 | 250.912 | 03690075 | 0.00257811 | 0.402160 | 256.365 |
| 1 | 03690068 | 0.392130 | 0.0126080 | 277.967 | 03690067 | 0.00000 | 0.404738 | 273.646 |
| 2 | 03690069 | 0.396232 | 0.00850600 | 273.422 | 03690070 | 0.00781655 | 0.396921 | 271.267 |
| 3 | 03690072 | 0.401498 | 0.00324002 | 248.794 | 03690071 | 0.00678879 | 0.397949 | 256.033 |