| Red | Green | Blue | |
| z | 17.64 | ||
| znorm | Inf | ||
| sky | -Inf | -Inf | -Inf |
| S/N | 27.1 | 44.8 | 53.4 |
| S/N(c) | 0.0 | 0.0 | 0.0 |
| SN(E/C) |

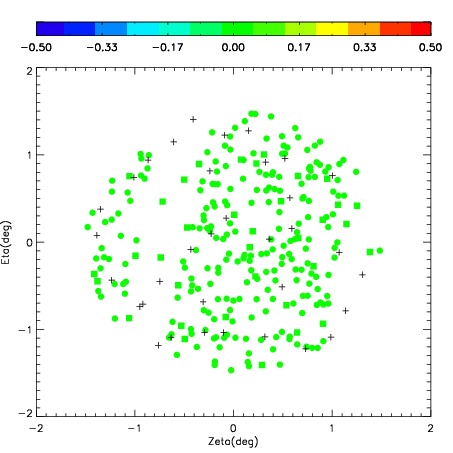
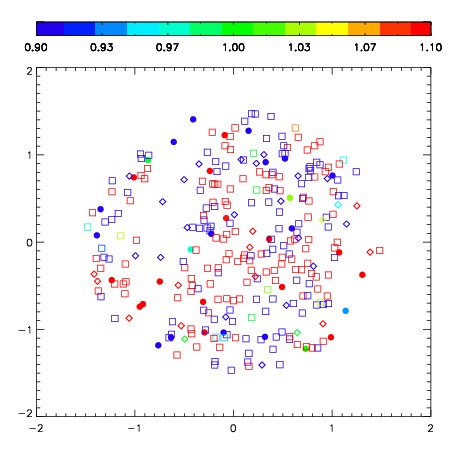
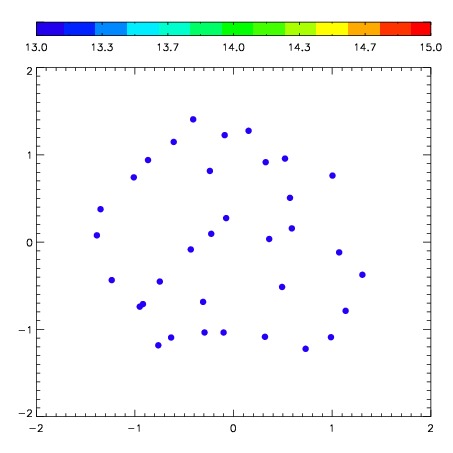
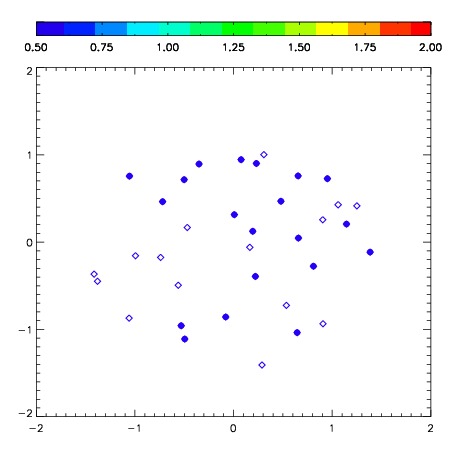
| Frame | Nreads | Zeropoints | Mag plots | Spatial mag deviation | Spatial sky 16325A emission deviations (filled: sky, open: star) | Spatial sky continuum emission | Spatial sky telluric CO2 absorption deviations (filled: H < 10) | |||||||||||||||||||||||
| 0 | 0 |
|
|
|
|
|
|
| IPAIR | NAME | SHIFT | NEWSHIFT | S/N | NAME | SHIFT | NEWSHIFT | S/N |
| 0 | 03710082 | 0.415873 | 0.00000 | 254.834 | 03710083 | 0.00561690 | 0.410256 | 259.090 |
| 1 | 03710077 | 0.405250 | 0.0106230 | 271.104 | 03710076 | 0.00000 | 0.415873 | 272.952 |
| 2 | 03710081 | 0.403363 | 0.0125100 | 268.218 | 03710080 | 0.00526220 | 0.410611 | 267.110 |
| 3 | 03710078 | 0.412478 | 0.00339499 | 266.030 | 03710079 | 0.00442836 | 0.411445 | 265.443 |